
How to Read Bollinger Bands? Touching the Lower Band Doesn’t Mean Cheap — Cheap Can Get Cheaper
“Price has hit the lower Bollinger Band — is this a chance to buy cheap?”
For many people, the first thing they learn about Bollinger Bands is: sell at the upper band, buy at the lower band.
Careful. Cheap can get cheaper.
This is part four of MASQuant’s “Trading Academy · The Truth About Indicators” series. This part covers Bollinger Bands: how they’re calculated, what the width of the bands is telling you, and why the same “touch of the lower band” means two different things in a range and in a trend.
The short answer
Touching the lower band doesn’t mean cheap.
The bands are a ruler, not a bargain list: in a range, look for bounces; in a trend, look at direction.
What are Bollinger Bands? How are they calculated?
Bollinger Bands were introduced by John Bollinger in the 1980s as a way to draw “how much price has been swinging lately” directly on a candlestick chart. They consist of three lines, and the most common setting is (20,2):
Middle band = simple average of the last 20 closes (20-period SMA)
Standard deviation = how spread out those 20 closes are around the middle band
Upper band = middle band + 2 × standard deviation
Lower band = middle band − 2 × standard deviation
Standard deviation is the statistical measure of “spread”: the more tightly the last 20 closes are clustered, the smaller it is; the more they jump up and down, the bigger it is. With every new candle, all three lines are recalculated using the latest 20.
A simple example (round numbers for illustration, not market data):
| Scenario | Middle band | Standard deviation | Upper band | Lower band |
|---|---|---|---|---|
| Quiet market | 100 | 3 | 100 + 6 = 106 | 100 − 6 = 94 |
| Volatile market | 100 | 6 | 100 + 12 = 112 | 100 − 12 = 88 |
With the same middle band, doubling the standard deviation doubles the width of the bands:
High volatility widens the bands; low volatility narrows them.
The calculation works for any instrument — forex, gold, index CFDs or stocks — and any timeframe, from 5-minute charts to weekly. Most of the time, price stays inside the bands — but “most of the time” is often overstated.
“95% of prices stay inside the bands”? That’s only a theoretical assumption
You may have heard that about 95% of prices fall inside the Bollinger Bands.
This comes from the normal distribution in statistics: if data is normally distributed, about 95% of it falls within ±2 standard deviations of the mean.
The problem is that “if”:
- Financial prices are not normally distributed. Big rallies and big drops happen more often than a normal distribution would predict — often called “fat tails”.
- The sample is small and constantly changing. The bands only use the last 20 candles and are recalculated with every one.
Even the usage rules John Bollinger compiled himself warn: don’t make statistical assumptions about the bands just because they use standard deviation.
So “95%” is a theoretical assumption, not a fact. In practice, price often breaks out of the bands; in a trend, it can ride along the edge candle after candle, or even close outside.
Ranges: the bands as a map of highs and lows
First, the situation where Bollinger Bands work best.
In a range, price moves back and forth within a zone, and the middle band stays roughly flat. Price pulls back when it touches the upper band and bounces when it touches the lower band — the bands act like a map showing roughly where the highs and lows of this stretch are.
The illustration below is a simulated market computed by a program (not the price action of any real instrument), with band settings of (20,2).
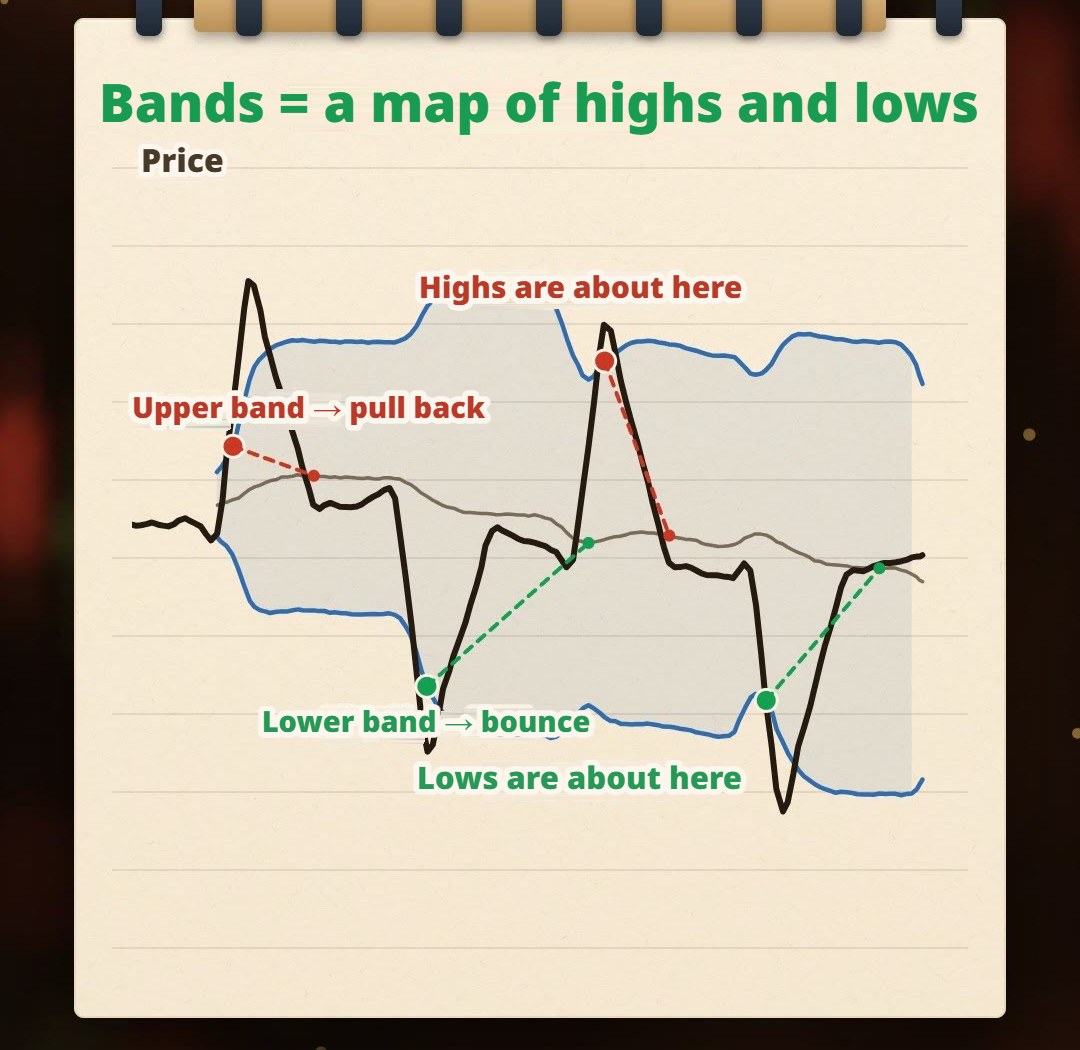
But here’s how to read this map: the originator defines the bands as relative highs and lows. Touching the upper band means “high compared with the recent period”; touching the lower band means “low” in the same sense.
Relatively low doesn’t mean cheap. It means “compared with the last 20 candles”, not “it’s going to rise back”.
Trends: price rides the lower band down
Then price drops to the lower band again. This time, do you buy?
Keep drawing and you’ll see. In the illustration, price doesn’t bounce; instead, it hugs the lower band all the way down.
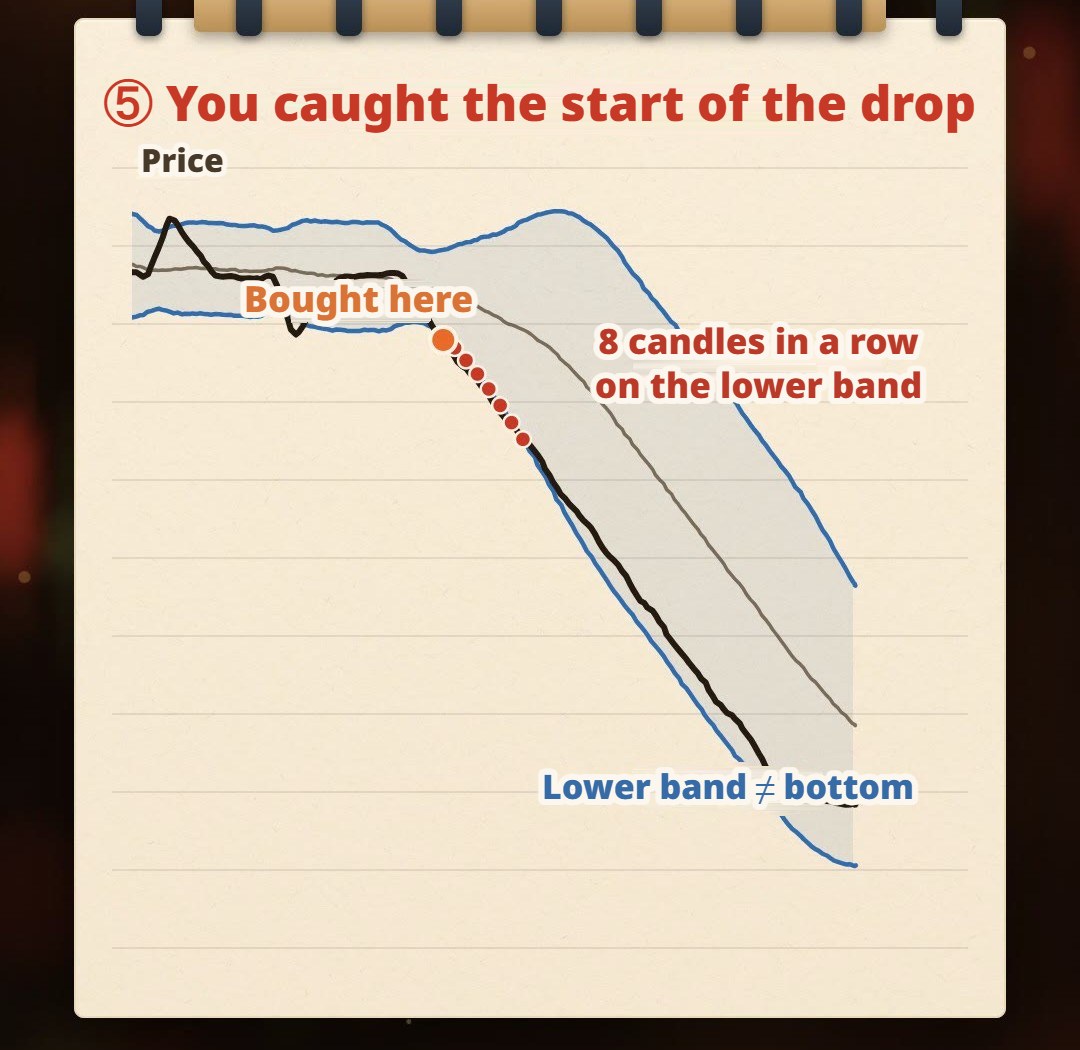
When a trend arrives, the bands bend down with price. The lower band is no longer a floor, just a line next to the price.
So in the illustration, anyone who bought at the first touch of the lower band:
Buying at the first touch of the lower band means buying at the start of the entire decline.
Why can’t the lower band hold?
Because the lower band is calculated from price — it doesn’t wait for you at a fixed level:
- As price keeps falling, the average of the last 20 candles falls with it; the middle band bends down, and the lower band moves down too.
- If the drop is steep, the last 20 prices become more spread out and the standard deviation grows, so the lower band can move down even faster than the middle band.
The “bottom” you had in mind keeps moving lower.
This is known as “walking the bands” — price riding along a band. John Bollinger’s own rules put it plainly: a touch of the upper band is not in itself a sell signal, and a touch of the lower band is not in itself a buy signal; in a trend, price can walk up the upper band or down the lower band. He even considers a close outside the bands to be, initially, more of a continuation sign than a reversal.
How can you tell a range from a trend?
The same touch of the lower band can be a low in a range but only a halfway point in a trend. No method can guarantee it in advance, but here are some common things to observe:
| Observation | More like a range | More like a trend |
|---|---|---|
| Direction of the middle band | Roughly flat | Clearly bending up or down |
| Width of the bands | Steady, or slowly narrowing | Suddenly widening |
| Where price is within the bands | Moving back and forth between the upper and lower bands | Mostly between the middle band and one outer band |
| After touching a band | Returns toward the middle band | Hugs the same side candle after candle, even closing outside |
These are descriptions, not signals. A range can turn into a trend on the next candle, and a trend can suddenly stop.
So “in a trend, look at direction” means: don’t treat the lower band as a floor; first check which way the middle band is bending and which half of the bands price is staying in.
BandWidth: what widening and narrowing bands tell you
How wide the bands are can be turned into a single number, called BandWidth:
BandWidth = (upper band − lower band) ÷ middle bandUsing the earlier example: in the quiet market it’s (106 − 94) ÷ 100 = 0.12; in the volatile market, (112 − 88) ÷ 100 = 0.24. Dividing by the middle band lets you compare instruments at different price levels.
When BandWidth shrinks to a relatively low level, the originator calls it “The Squeeze”, and it’s often watched for a possible pickup in volatility. But remember: narrowing only says volatility has shrunk — it doesn’t tell you which direction comes next.
The (20,2) setting is a default, not a standard answer
(20,2) means: the middle band and standard deviation are both calculated over 20 candles, and the outer bands are 2 standard deviations from the middle.
The originator himself says these numbers are just defaults, and the settings you actually need depend on the market and purpose. He also suggested a direction for adjusting: lengthen the period and raise the multiplier (e.g. 50 periods with 2.1); shorten the period and lower it (e.g. 10 periods with 1.9), so the bands contain price more consistently.
Also, “20” follows the candles: 20 candles on a 5-minute chart is 100 minutes; 20 candles on a daily chart is roughly a month of trading days. Both are called (20,2), but they measure very different lengths of market.
The same indicator with different settings can give completely different results — Why Do Most Trading Strategies Fail? discusses this in more depth. But don’t go the other way and tune the settings until the past chart looks perfect: that may just fit the past, and a different stretch of market can look completely different.
Common mistakes
1. Treating “touching the lower band” as a buy signal
Touching the lower band only says price is “low compared with the last 20 candles”. In a range it may be a low; in a trend it may just be the start of the decline.
2. Assuming price “will definitely come back” after breaking out of the bands
This mostly comes from the “95% stay inside the bands” claim. That’s only a theoretical assumption; in a trend, price can stay at or beyond the edge of the bands for several candles in a row.
3. Guessing the breakout direction when the bands narrow
Narrowing is about volatility, not direction. After narrowing, price may go up, go down, or keep moving sideways.
4. Treating the lower band as a fixed support line
The lower band is recalculated with every candle and keeps moving down in a trend. Using it as a “level that holds” means your reference point keeps running away.
If you really want to try buying near the lower band, follow the logic of How to Set a Stop Loss? and answer one question first: at what price would I know I’m wrong? If you can’t answer, the problem isn’t the bands — it’s your reason for entering.
FAQ
What are Bollinger Bands, and how are they calculated?
Bollinger Bands, introduced by John Bollinger in the 1980s, consist of three lines: the middle band is a simple moving average of the last 20 closes, and the upper and lower bands are the middle band plus and minus 2 standard deviations. The bands widen when volatility is high and narrow when it’s low.
What does the (20,2) setting mean? Can I change it?
20 is the number of candles used to calculate the middle band and standard deviation, and 2 is how many standard deviations the outer bands sit from the middle. It’s a default, not a standard answer; the originator also says the settings you need depend on the market and purpose, and suggests raising the multiplier when you lengthen the period and lowering it when you shorten it. Test any changes yourself, and don’t just pick whichever set made the past look best.
Is a drop to the lower Bollinger Band a buy signal?
Not necessarily. Touching the lower band only means price is low compared with the last 20 candles, and the originator explicitly says a touch of the lower band is not in itself a buy signal. In a range, the lower band is more like a reference for that range’s low; in a trend, price can hug the lower band all the way down, and buying at the first touch may mean buying at the start of the whole decline.
Is it true that 95% of prices fall inside the Bollinger Bands?
It’s only a theoretical assumption. It comes from the normal distribution: if data were normally distributed, about 95% would fall within ±2 standard deviations of the mean. But financial prices aren’t normally distributed — big rallies and drops happen more often than a normal distribution predicts — and the bands only use the last 20 candles, so in practice price often breaks out, and in a trend it can ride along the edge of the bands.
What does narrowing BandWidth mean?
BandWidth = (upper band − lower band) ÷ middle band, a measure of how wide the bands are. When it shrinks to a relatively low level, the originator calls it “The Squeeze”, and it’s often watched for a possible pickup in volatility. But narrowing only says volatility has shrunk; it doesn’t tell you which direction comes next.
How can Bollinger Bands help tell a range from a trend?
No method can guarantee it in advance. Common things to observe include whether the middle band is flat or clearly bending one way, whether the bands are steady or suddenly widening, and whether price is moving back and forth between the bands or hugging one side. These are descriptions, not signals, and a range can turn into a trend on the next candle.
Final thoughts
Bollinger Bands answer: compared with the last 20 candles, is price high or low right now? They don’t answer whether it will bounce next.
The bands are a ruler, not a bargain list: in a range, look for bounces; in a trend, look at direction.
What about your instrument? After touching the lower band, does it bounce more often, or keep falling?
You don’t have to guess — backtest it with our AI Strategy Assistant. Write “buy at the lower band” as one sentence — when to enter, where to exit, and how far down means you were wrong — and give it to MASQuant’s AI Strategy Assistant to backtest on historical data. The AI Strategy Assistant already supports common indicators like Bollinger Bands, and the backtest environment includes real-world market frictions such as spreads, slippage, changing liquidity and execution delays.
Writing an idea as clear conditions and testing it on historical data is where quantitative trading begins. A backtest tells you “what happened in the past”, not that the future will be the same.
An idea only becomes a strategy once it’s been tested.
Risk disclosure: CFDs are high-risk financial products and can lead to rapid loss of capital. Past performance does not guarantee future results. All strategies and backtests are for reference only and do not constitute investment advice. Please read our Risk Disclosure carefully before trading.
Further reading:


