
What Is the Hull Moving Average (HMA)? Almost No Lag, at the Cost of Overshooting
“The HMA has almost no lag and is even faster than the EMA. Isn’t it the best way to judge direction?”
The HMA really is fast: it uses “twice a fast average minus a slow average” to push the lagging part of a moving average back forward. The price is that when it pushes too far, it runs outside the range of the prices themselves; and in a range, it also turns with every small swing. This article first works it out once with 4 candles, then puts the HMA side by side with the SMA on a real chart marked 1 to 5 (USD/JPY, 2022).
This article is part of MASQuant’s “Trading Academy · Technical Indicators” series. All the indicators are sorted by category in Technical Indicators: The Complete Guide.
In one sentence
HMA = using the difference between two weighted moving averages to make up for a moving average’s lag, then smoothing the result once more.
The question it answers is the same as for an ordinary moving average: “Which way have recent prices been heading?” It just answers faster.
The HMA is like watching the road ahead while driving, rather than the rear-view mirror. An ordinary moving average tells you “which way the road you just drove along curved”; the HMA uses your recent speed to estimate “where you will roughly be next”. On a straight road it is very accurate; on a sharp bend, it first shoots out a little before turning back. It is fast because it is estimating; it overshoots because it is estimating, too.
Work it out once: how the HMA ends up outside the prices
To keep the arithmetic simple, use a 4-bar HMA. The closing prices are 100, 102, 104 and 106 in turn (the following are round numbers made up for the example, not market data). A WMA is a weighted average: the more recent the price, the larger its weight.
| Step | Calculation | Result |
|---|---|---|
| 2-bar WMA (fast) | (106 × 2 + 104 × 1) ÷ 3 | 105.33 |
| 4-bar WMA (slow) | (106 × 4 + 104 × 3 + 102 × 2 + 100 × 1) ÷ 10 | 104.00 |
| 2 × fast − slow | 2 × 105.33 − 104.00 | 106.67 |
The highest of the four closes is 106, yet “2 × fast − slow” comes out at 106.67, higher than any of the closes. This is how the HMA reduces lag: the amount by which the fast line exceeds the slow line is added on once more, which amounts to pushing one step forward. The final step is to run this result through another short WMA to smooth the line a little.
An ordinary average (SMA) can never go beyond the numbers being averaged; the HMA can, which is why it reacts quickly and also overshoots.
The formula
The usual setting is 20 (some people use 9, 16 or 55):
1 Fast line = 10-period WMA of the close (half the period)
2 Slow line = 20-period WMA of the close
3 Raw value = 2 × fast line − slow line
4 HMA = 4-period WMA of the raw value (√20, rounded to a whole number)
The HMA was introduced by Alan Hull in 2005, with the aim of creating a moving average that is “both smooth and lag-free”. In practice, the two cannot both be achieved perfectly: with less lag comes a bit more noise.
MT5 has no built-in HMA, so you need to install a custom indicator separately; different versions may round the period in the last step differently, so values can differ slightly.
Read the chart: USD/JPY in 2022, following 1 to 5
The chart below shows USD/JPY (USDJPY) on the daily timeframe from early May 2022 to mid-January 2023, taken from MT5’s historical prices. It went through a range, a rally and a decline in turn: from May to mid-August it closed back and forth between 126.8 and 138.9; from mid-August to 20 October it rose from 134.18 to 150.10, a gain of 11.9%; after that, by 17 January 2023, it had fallen back to 128.08, 14.7% below the high. The orange line is HMA(20) and the purple line is the 20-period simple moving average, SMA(20).
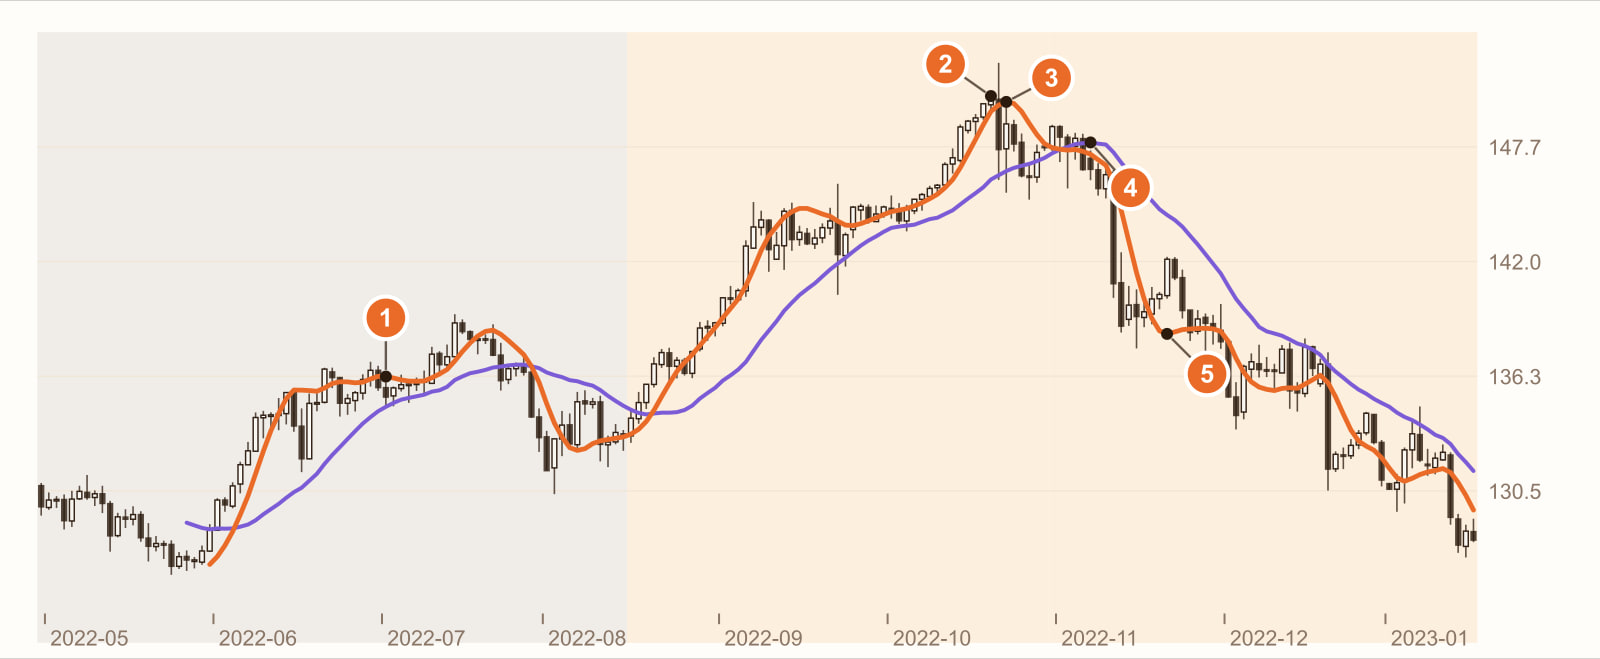
In the range, the HMA keeps changing direction (1 July 2022). In the range (counting from the point where all the moving averages have values), the HMA changed direction 8 times, the 20-period EMA 3 times, and the SMA only once. The HMA goes up and down with every small swing.
The price high: 20 October 2022, close 150.10.
The HMA peaks on the 2nd bar after the high (24 October). You could see it had turned the very next day, when the price was 1.5% below the high.
The SMA only peaks on the 13th bar after the high (7 November). By the time you could see it had turned, the next day, the price was already 3.0% below the high. The 20-period EMA was in between: it peaked on the 11th bar, by which time the price had fallen 2.3%.
Overshooting: the HMA drops below the lowest of the last 20 closes (21 November). After the sharp fall, the HMA pushed down too far, ending up lower than the lowest close of the last 20 bars. Across the rally and the decline, the HMA ran outside the range of the last 20 closes on 7 bars. A 20-period SMA cannot do this: an average can never go beyond the numbers being averaged.
This is a real stretch of historical prices, used to show how the HMA behaves. It is not a general rule. Change the instrument, the timeframe or the period, and every number will change.
What you see, what it means
| What you see | What it usually means | But be careful |
|---|---|---|
| The HMA is rising | Recent prices are heading up | It changes direction often in a range (1 on the chart) |
| The HMA turns down | Prices are starting to fall faster | It reacts quickly, and gives plenty of false signals too |
| The HMA turns well before the SMA | The HMA lags less | On the chart, 2 bars after the high versus 13 (3 and 4) |
| The HMA runs outside the recent price range | It is estimating, and has pushed too far | Ordinary moving averages never do this (5 on the chart) |
| The price crosses back and forth over the HMA | No clear direction | At times like this, the HMA’s direction is of little use |
How to use it: three examples
Example 1: use the HMA’s direction as an exit signal
Because the HMA turns quickly, it suits “getting out a little earlier”: “Hold a long position, and exit when the HMA turns down.” At the high on the chart, it gave back a good chunk less than the SMA.
Example 2: let a slow moving average handle direction and the HMA handle timing
The rule can be written as: “Go long only when the price is above the 50-period moving average; enter when the HMA turns up from below.” The slow average keeps you out of ranges, and the HMA is in charge of catching the turns.
Example 3: add a “the turn must be confirmed” condition
To cut down on direction changes in ranges, you can require “the HMA moves in the same direction for 2 bars in a row” before you count it as a turn. The price is being a little slower again: speed and stability are always a trade-off.
All three examples have to accept the same thing: the HMA trades estimation for speed. When the market keeps moving in one direction, the estimate is accurate; when the market swings back and forth or turns sharply, the estimate goes wrong and overshoots.
Common mistakes
1. Thinking the HMA has no drawbacks
The HMA turned just 2 bars after the high, which looks great; but in the range on the same chart, it changed direction 8 times, against only once for the SMA. The price of speed is noise.
2. Treating the HMA as support and resistance
Ordinary moving averages are often treated as “where a pullback will stop”. The HMA hugs the price very closely and also overshoots (5 on the chart), so if you treat it as support or resistance, it can easily break at the first touch.
3. Reading “price above the moving average” as you would for an ordinary moving average
The HMA can go beyond the range of prices, so sometimes the price is still rising yet ends up below the HMA. What tells you more is the HMA’s own direction, not whether the price is above or below it.
FAQ
What is the HMA?
The HMA (Hull Moving Average) was introduced by Alan Hull. It uses “twice a short-period WMA minus a long-period WMA” to reduce lag, then smooths the result with another short WMA, so it turns much faster than an SMA or EMA.
Which is better, the HMA or the EMA?
It depends on what you use it for. The HMA turns faster and suits catching turns and exiting early; the EMA is steadier, with fewer false turns in ranges. In our example, after the high the HMA turned in 2 bars and the EMA in 11; in the range, the HMA changed direction 8 times and the EMA 3 times.
What settings should the HMA use?
Common ones are 9, 16, 20 and 55. The shorter the period, the faster and noisier it is; the longer, the steadier and slower. It is best to compare them with a backtest on your own instrument and timeframe.
Does MT5 have the HMA?
MT5 has no built-in HMA, so you need to install a custom indicator separately.
Conclusion
The HMA fixes a large part of a moving average’s biggest weakness, lag, and in exchange takes on another one: it estimates, it overshoots, and in a range it turns with small swings.
So the real question is: if you switch your exit rule from “price falls below the SMA” to “the HMA turns down”, is the profit you no longer give back enough to make up for the extra trades in ranges? One stretch of historical prices cannot answer that; you need to backtest the rule across many stretches of the market.
No rules of your own yet, and don’t want to piece them together one indicator at a time? With MASQuant’s Strategy Genie, you just pick an investment style first; the AI analyses market conditions, selects instruments and gives you three candidate strategies at once. Each one has already been backtested on historical data, with its returns and maximum drawdown of capital laid out in full, and then you decide whether to deploy it to MT5.
If you already have an idea of your own, write the condition as one sentence, for example “go long only when the price is above the 50-period moving average and HMA(20) turns up from below, and exit when the HMA turns down”, give it to the AI Strategy Assistant, and press go to start the backtest. The backtest environment includes real market frictions such as spreads, slippage, changes in market liquidity and execution delays (see the AI Strategy Assistant guide for how to use it). Then swap the HMA for a 20-period EMA and run it again, and you will see whether the extra speed is worth it. A backtest tells you “how this rule performed in past market conditions”, not a guarantee about the future.
An idea only becomes a strategy once it’s been tested.
The price chart in this article is taken from historical prices on the MT5 platform (daily; quotes and daily candle cut-off times differ slightly between platforms, so values may not match exactly), and the indicators are calculated by a program using the standard formulas; the round numbers in the example are not market data. Historical prices are used only to show how the indicator behaves and do not represent future price movements.
Risk disclosure: CFDs are high-risk financial products and can lead to rapid loss of capital. Past performance does not guarantee future results. All strategies and backtests are for reference only and do not constitute investment advice. Please read our Risk Disclosure carefully before trading.


