MASQuant
ZH|CN|EN|JA|VI|ID
  • AI Trading
    • Product Overview
    • Strategy Genie
    • AI Strategy Assistant
    • API & Developer Tools
  • Pricing
  • Partnerships
  • Resources
    • Trading Academy
    • Documentation & API
Log In
Sign Up
MasQuant
MasQuant MasQuant
  • AI Trading
    • Product Overview
    • Strategy Genie
    • AI Strategy Assistant
    • API & Developer Tools
  • Pricing
  • Partnerships
  • Resources
    • Trading Academy
    • Documentation & API
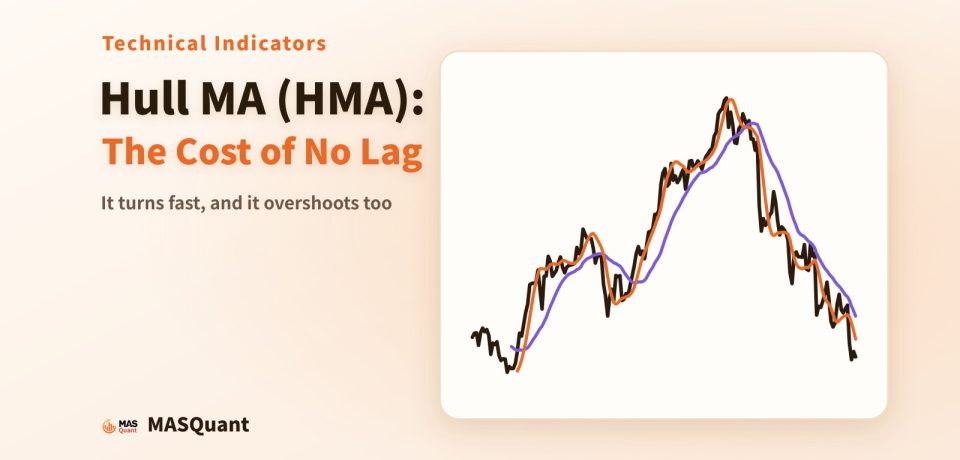
Article cover: a simplified chart of USD/JPY in 2022 with the HMA and the SMA, titled "Hull MA (HMA): The Cost of No Lag"
CFD MASQuant Technical Analysis Technical Indicator
Oct 27, 2026

What Is the Hull Moving Average (HMA)? Almost No Lag, at the Cost of Overshooting

Read More
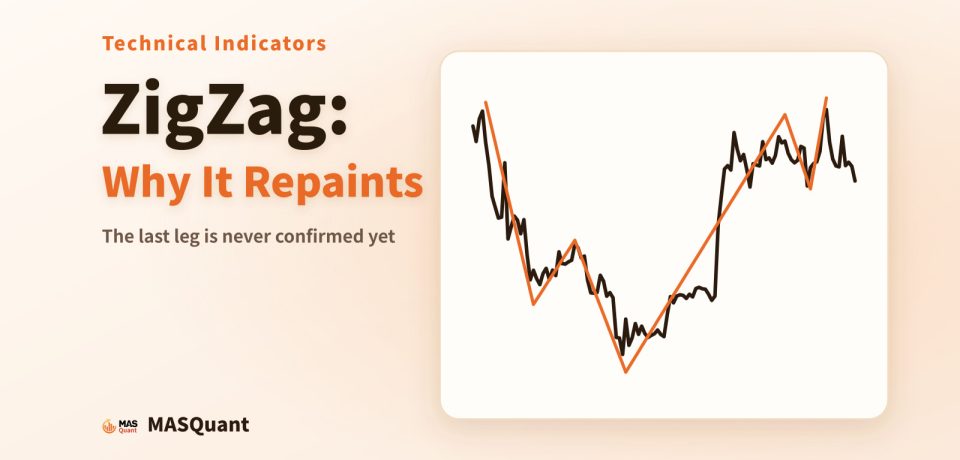
Article cover: a simplified chart of Ethereum in 2025 with the ZigZag line, titled "ZigZag: Why It Repaints"
CFD MASQuant Technical Analysis Technical Indicator
Oct 27, 2026

What Is the ZigZag Indicator? Why the Highs and Lows It Draws Get Redrawn

Read More
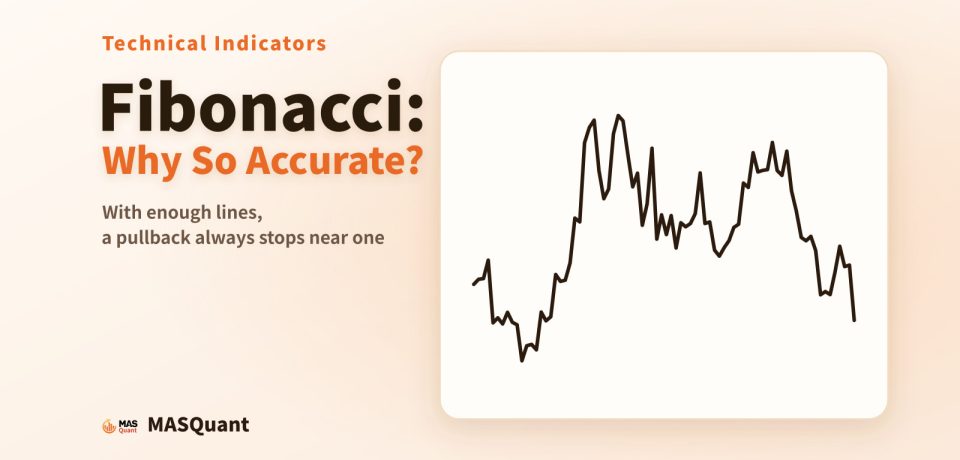
Article cover: a simplified chart of silver in 2024, titled "Fibonacci: Why So Accurate?"
CFD MASQuant Technical Analysis Technical Indicator
Oct 27, 2026

What Is Fibonacci Retracement? Why 61.8% Always Seems So Accurate

Read More
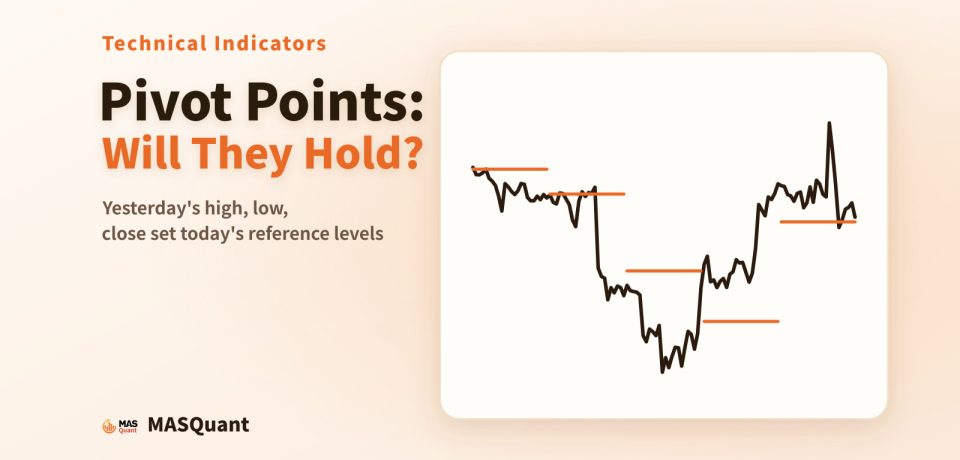
Article cover: a simplified hourly chart of EUR/USD in January 2025 with daily pivot lines, titled "Pivot Points: Will They Hold?"
CFD MASQuant Technical Analysis Technical Indicator
Oct 27, 2026

What Are Pivot Points? Do R1 and S1 Really Hold?
Read More
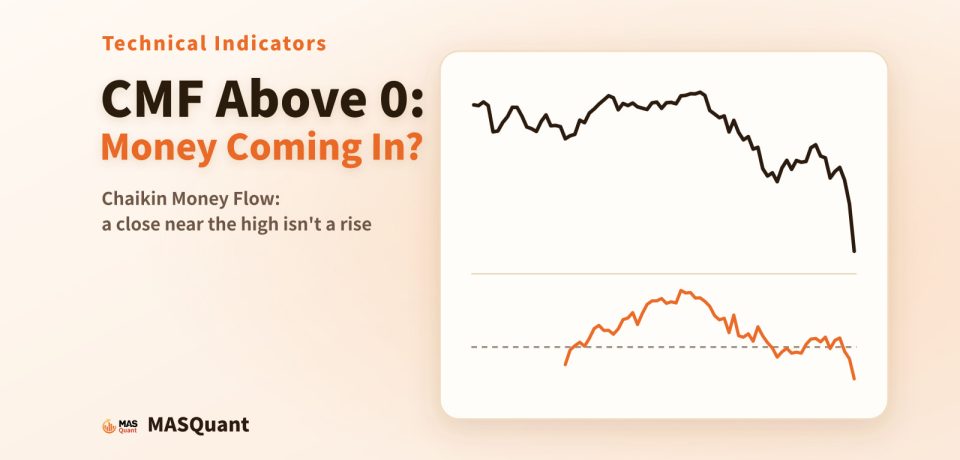
Article cover: a simplified chart of the S&P 500 in early 2025 with the CMF line below, titled "CMF Above 0: Money Coming In?"
CFD MASQuant Technical Analysis Technical Indicator
Oct 27, 2026

What Is Chaikin Money Flow (CMF)? Does CMF Above 0 Mean Money Is Flowing In?

Read More
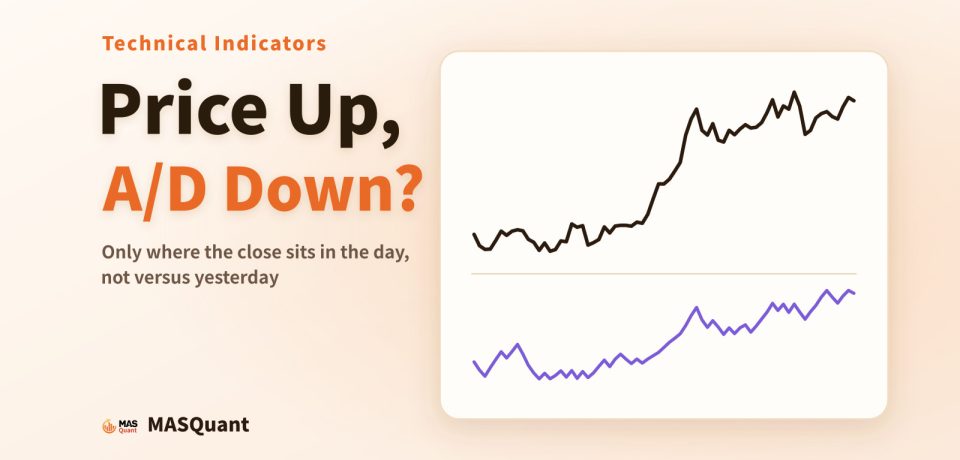
Article cover: a simplified chart of gold from late 2019 to early 2020 with the A/D and OBV lines below, titled "Price Up, A/D Down?"
CFD MASQuant Technical Analysis Technical Indicator
Oct 27, 2026

What Is the Accumulation/Distribution (A/D) Line? Why A/D Can Fall When the Price Rises

Read More
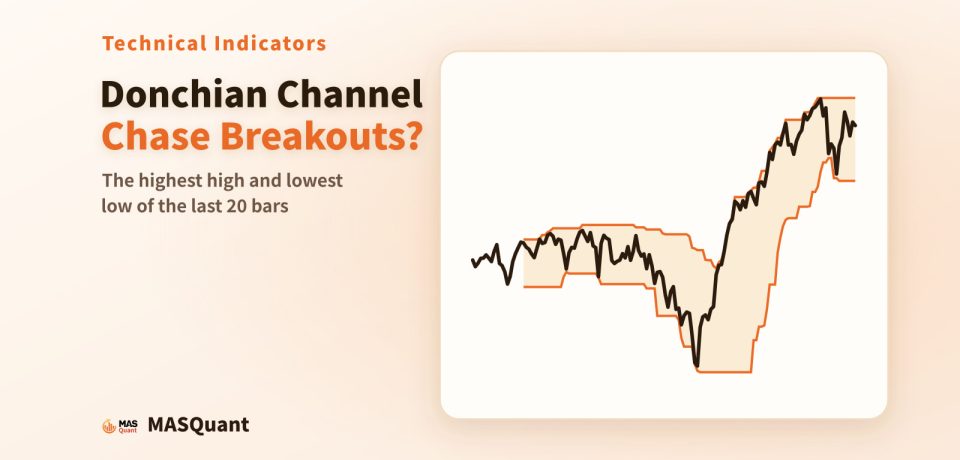
Article cover: a simplified chart of the S&P 500 in 2025–2026 with the Donchian Channel, titled "Donchian Channel: Chase Breakouts?"
CFD MASQuant Technical Analysis Technical Indicator
Oct 27, 2026

What Is the Donchian Channel? Should You Chase a Break Above the 20-Day High?

Read More
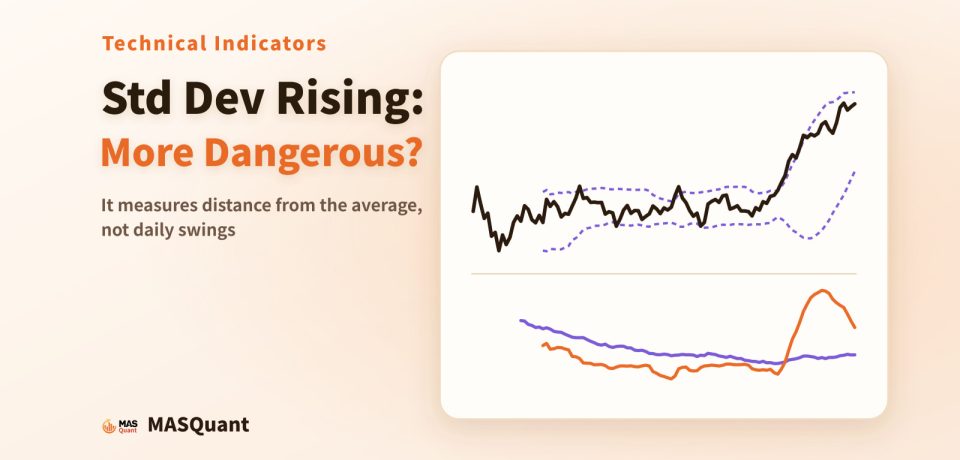
Article cover: a simplified chart of gold in 2025 with Bollinger Bands, and standard deviation and ATR below, titled "Std Dev Rising: More Dangerous?"
CFD MASQuant Technical Analysis Technical Indicator
Oct 27, 2026

What Is the Standard Deviation Indicator? Does a Rising Standard Deviation Mean the Market Is Getting Dangerous?

Read More
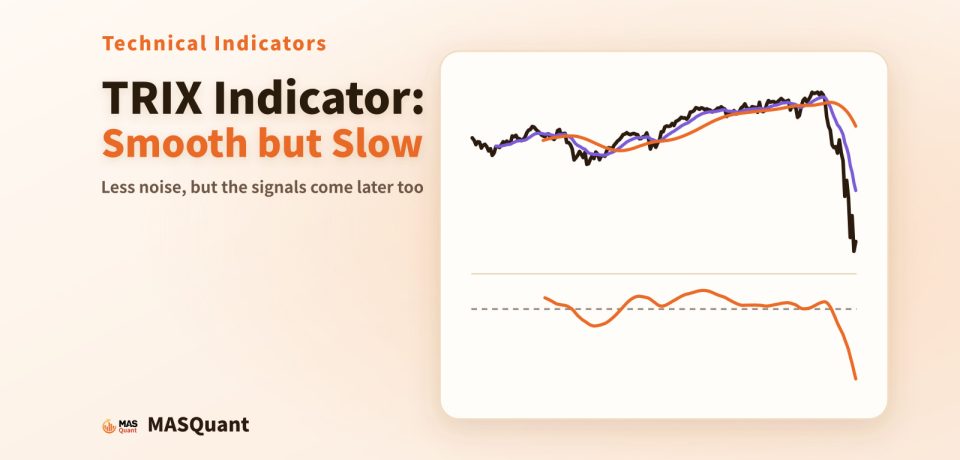
Article cover: a simplified chart of the Germany 40 index in 2019–2020 with the TRIX line below, titled "TRIX Indicator: Smooth but Slow"
CFD MASQuant Technical Analysis Technical Indicator
Oct 27, 2026

What Is the TRIX Indicator? Smoothed Three Times: Less Noise, but Later Signals

Read More
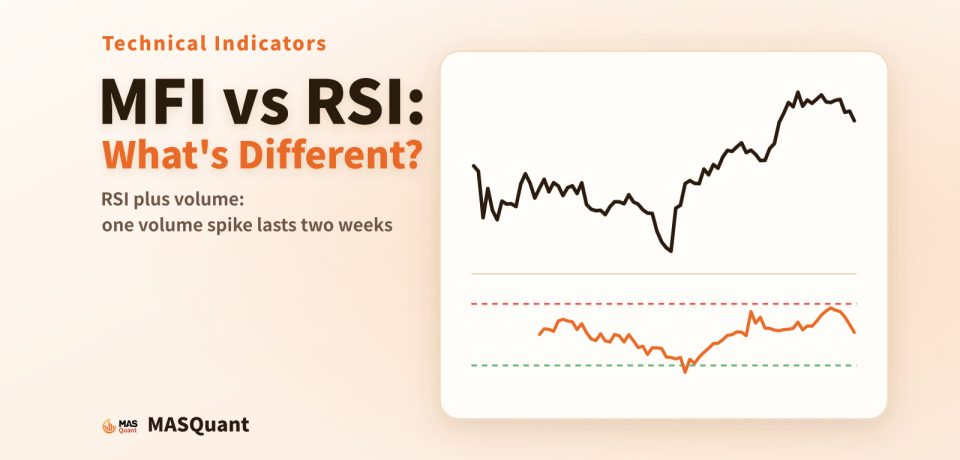
Article cover: a simplified chart of the S&P 500 in late 2016 with the MFI line below, titled "MFI vs RSI: What's Different?"
CFD MASQuant Technical Analysis Technical Indicator
Oct 27, 2026

What Is the Money Flow Index (MFI)? RSI With Volume Added, Where One Volume Spike Lasts Two Weeks

Read More
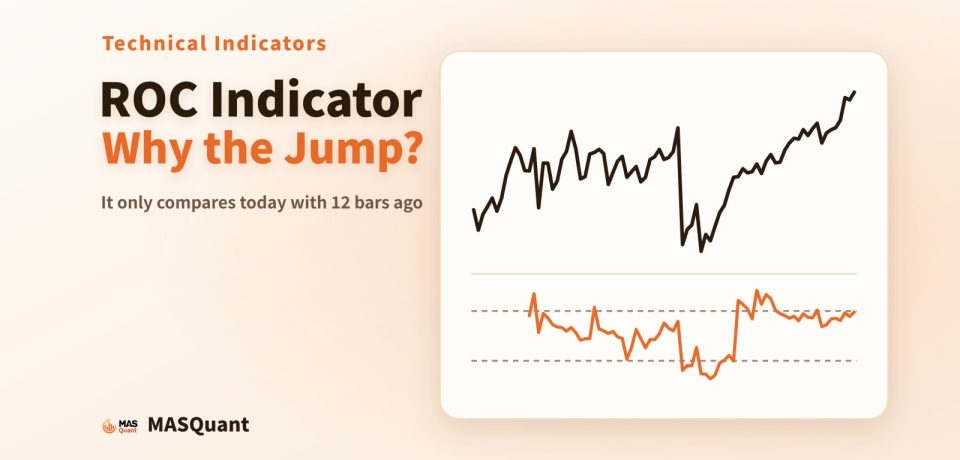
Article cover: a simplified chart of USD/JPY in 2026 with the ROC line below, titled "ROC Indicator: Why the Jump?"
CFD MASQuant Technical Analysis Technical Indicator
Oct 27, 2026

What Is the Rate of Change (ROC)? Why ROC Jumps When the Price Hasn’t Moved

Read More
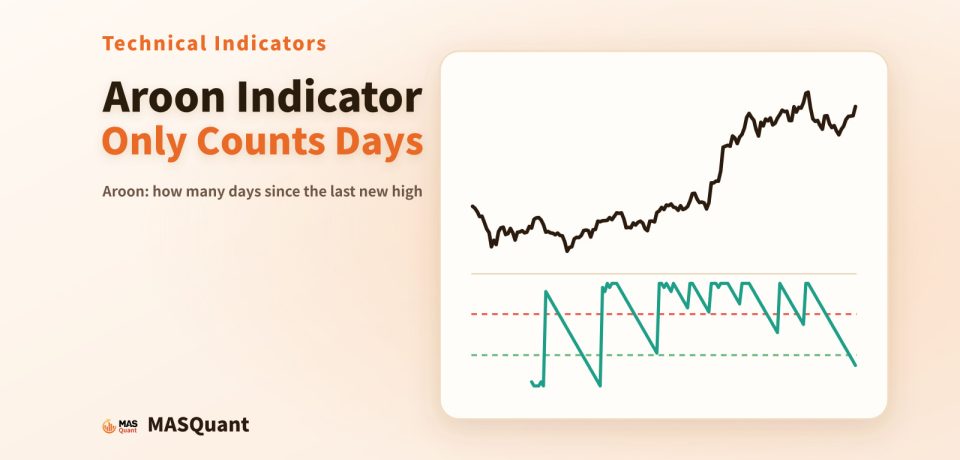
Article cover: a simplified chart of Bitcoin in the second half of 2024 with the Aroon Up line below, titled "Aroon Indicator: Only Counts Days"
CFD MASQuant Technical Analysis Technical Indicator
Oct 27, 2026

What Is the Aroon Indicator? It Only Counts Days, Not How Far the Price Has Risen

Read More
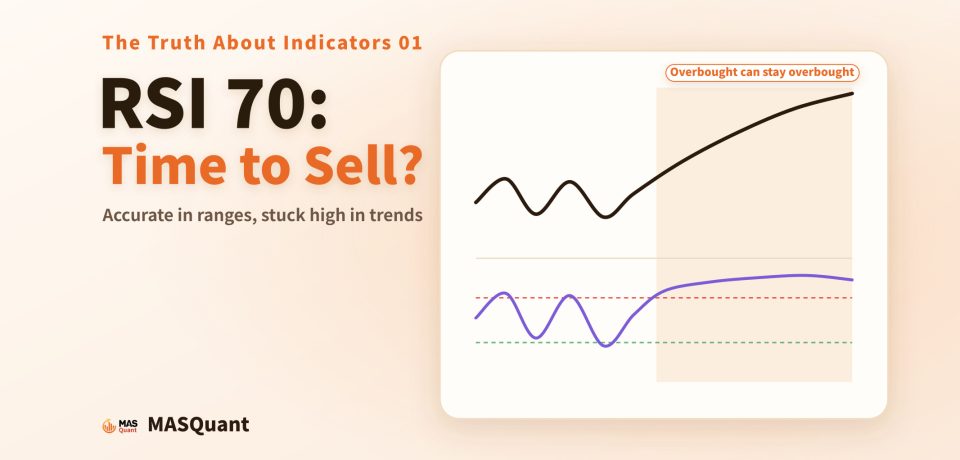
RSI 70: Time to Sell? Article cover: the price first moves sideways in a range and then climbs steadily, while the RSI below first swings between 30 and 70 and then stays above 70 once the trend begins
CFD MASQuant Risk Management Technical Analysis
Oct 24, 2026

How to Read the RSI Indicator? Should You Sell at RSI 70? Accurate in Ranges, Stuck High in Trends

Read More
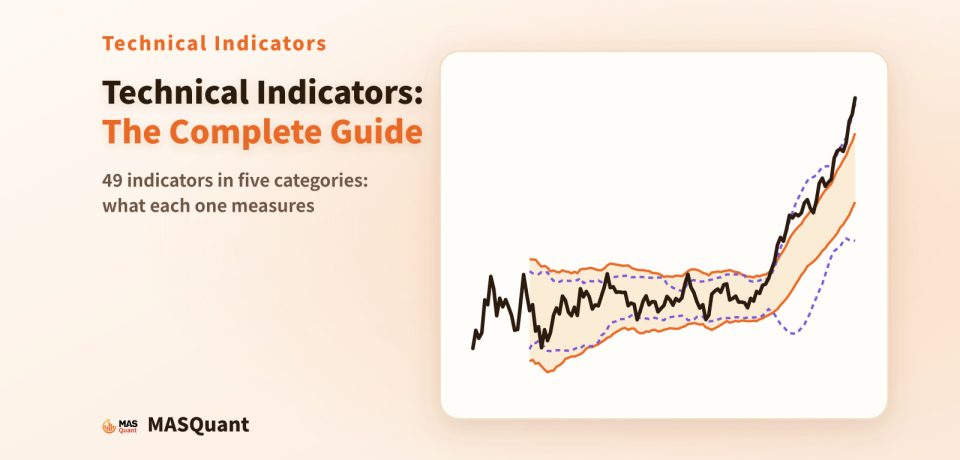
Article cover: a simplified chart with price bands and indicator lines, titled "Technical Indicators: The Complete Guide"
CFD MASQuant Technical Analysis Technical Indicator
Oct 15, 2026

Technical Indicators: The Complete Guide to 49 Common Indicators, Sorted by What They Measure

Read More
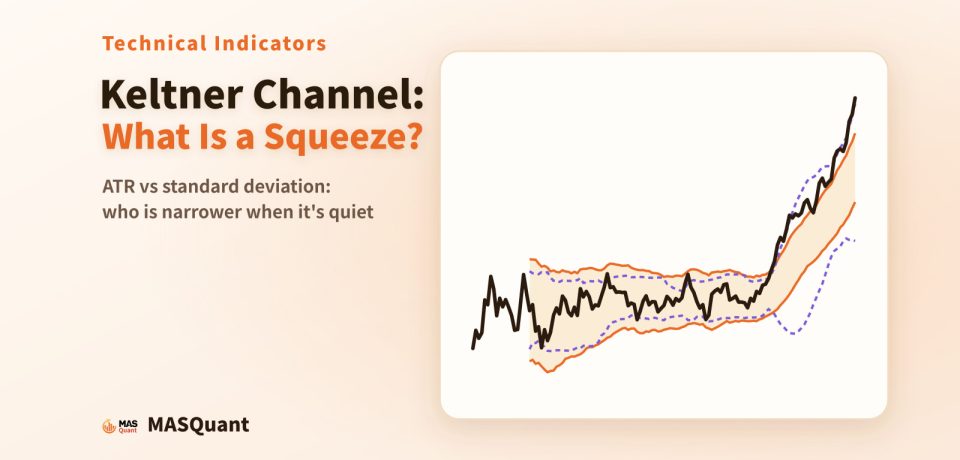
Article cover: a simplified chart of gold in 2025 with the Keltner Channel and Bollinger Bands overlaid, titled "Keltner Channel: What Is a Squeeze?"
CFD MASQuant Technical Analysis Technical Indicator
Oct 15, 2026

What Is the Keltner Channel? How It Differs from Bollinger Bands, and What a “Squeeze” Really Is

Read More
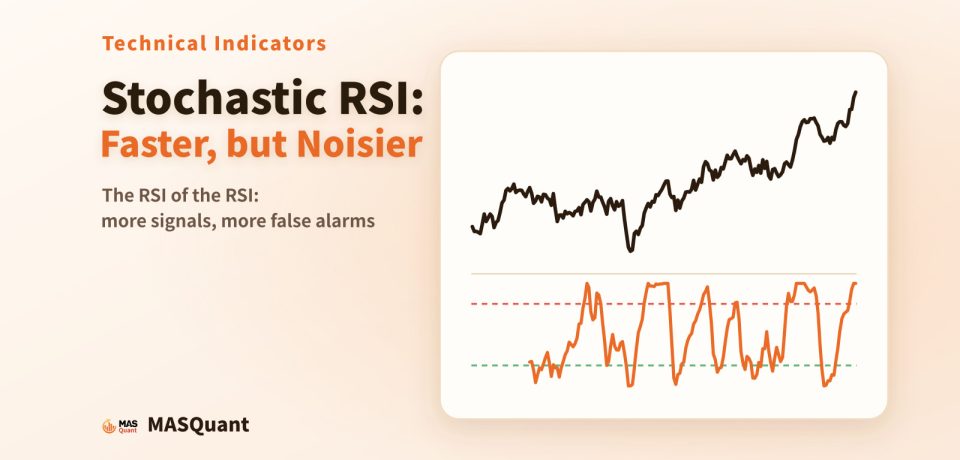
Article cover: a simplified chart of the Germany 40 index in 2024 with RSI and Stochastic RSI panels, titled "Stochastic RSI: Faster, but Noisier"
CFD MASQuant Technical Analysis Technical Indicator
Oct 15, 2026

What Is Stochastic RSI? More Sensitive, and Wrong More Often

Read More
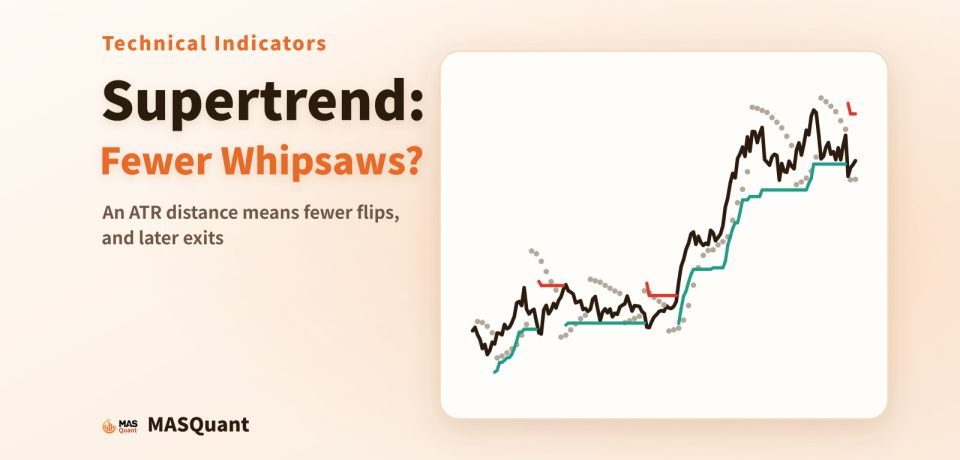
Article cover: a simplified chart of gold in 2023–2024 with the Supertrend line, titled "Supertrend: Fewer Whipsaws?"
CFD MASQuant Technical Analysis Technical Indicator
Oct 15, 2026

What Is Supertrend? Keeping an ATR Distance Means Fewer Flips, but Later Exits

Read More
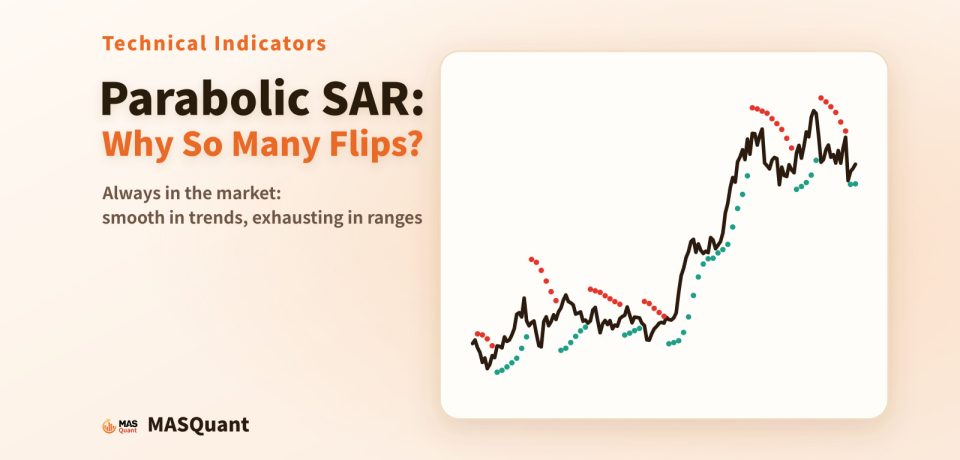
Article cover: a simplified chart of gold in 2023–2024 with Parabolic SAR dots, titled "Parabolic SAR: Why So Many Flips?"
CFD MASQuant Technical Analysis Technical Indicator
Oct 15, 2026

What Is the Parabolic SAR? Smooth in a Trend, Shaken Out Again and Again in a Range

Read More
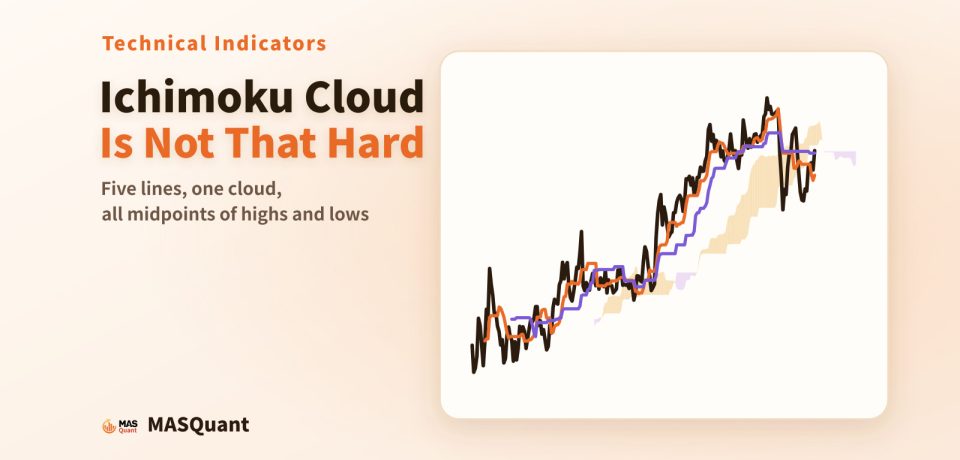
Article cover: a simplified chart of USD/JPY in 2025 with the Ichimoku cloud, titled "Ichimoku Cloud Is Not That Hard"
CFD MASQuant Technical Analysis Technical Indicator
Oct 15, 2026

How to Read the Ichimoku Cloud: Five Lines and a Cloud, and Almost All of Them Are Midpoints of Highs and Lows

Read More
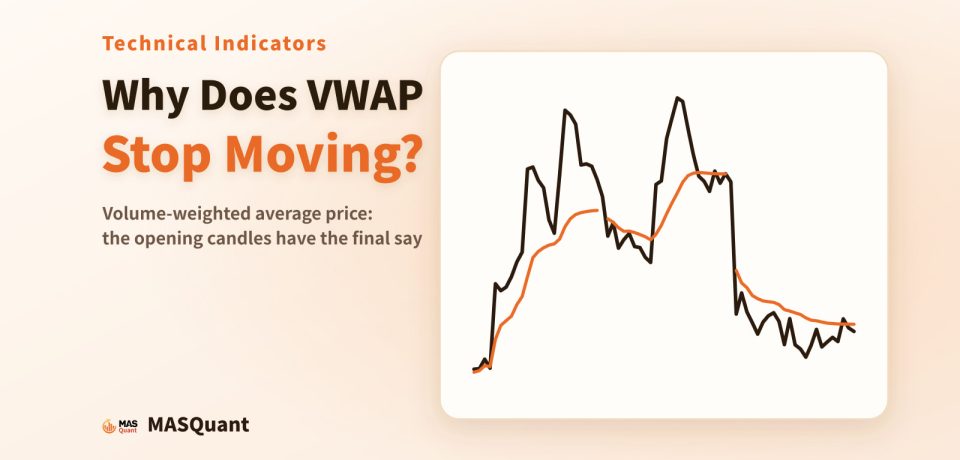
Article cover: a simplified chart of EUR/USD hourly candles over three days in January 2025 with VWAP restarting each day, titled "Why Does VWAP Stop Moving?"
CFD MASQuant Technical Analysis Technical Indicator
Oct 15, 2026

What Is VWAP? Why the Volume-Weighted Average Price Gets Harder to Move as the Day Goes On

Read More
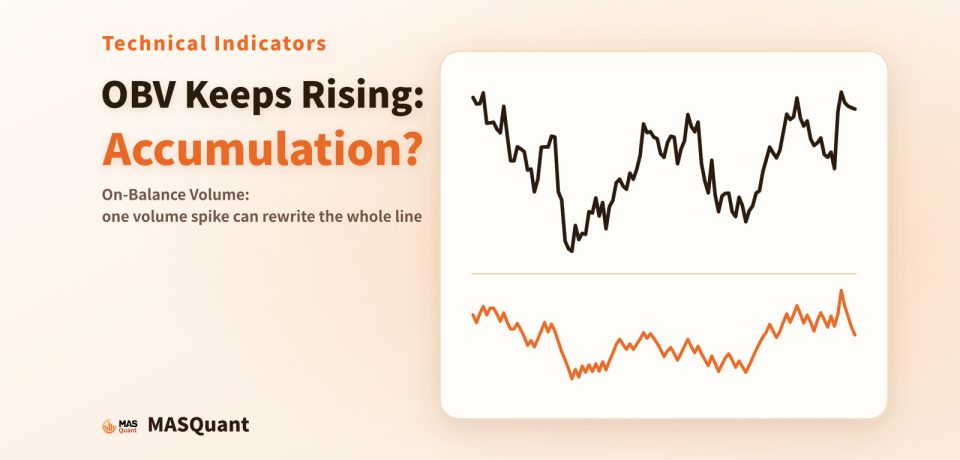
Article cover: a simplified chart of EUR/USD in 2024 with volume bars and the OBV line, titled "OBV Keeps Rising: Accumulation?"
CFD MASQuant Technical Analysis Technical Indicator
Oct 15, 2026

What Is the OBV Indicator? If OBV Keeps Rising, Is Someone Accumulating?

Read More
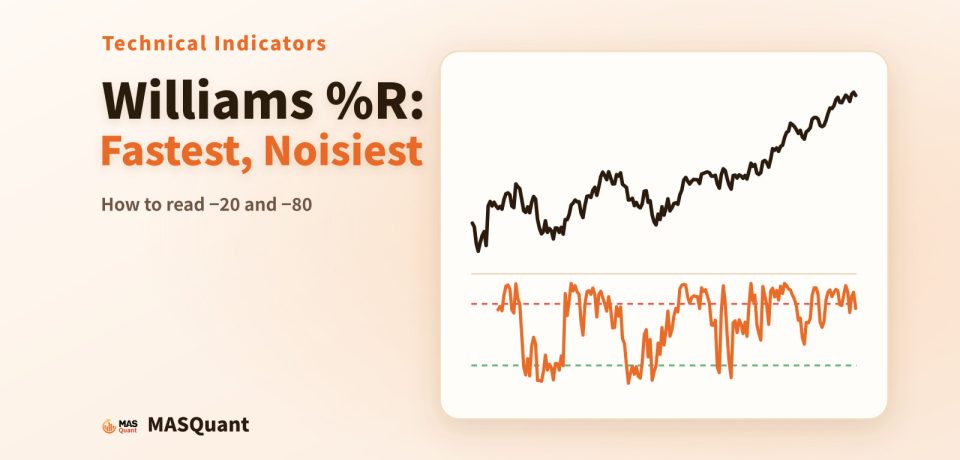
Article cover: a simplified chart of the S&P 500 in 2022–2023 with Williams %R below, titled "Williams %R: Fastest, Noisiest"
CFD MASQuant Technical Analysis Technical Indicator
Oct 15, 2026

What Is Williams %R? The Fastest Oscillator, and the Noisiest

Read More
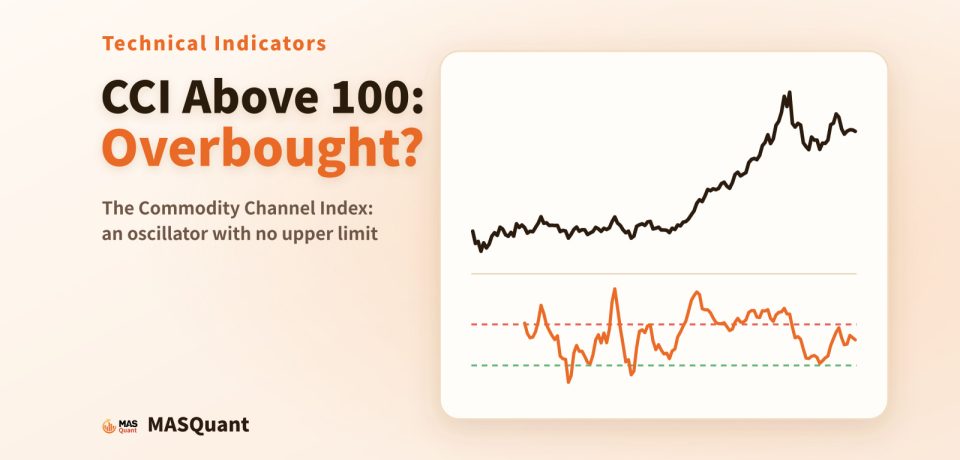
Article cover: a simplified chart of gold in 2025 with the CCI line below, titled "CCI Above 100: Overbought?"
CFD MASQuant Technical Analysis Technical Indicator
Oct 15, 2026

What Is the CCI Indicator? Is CCI Above 100 Overbought? An Oscillator With No Ceiling

Read More
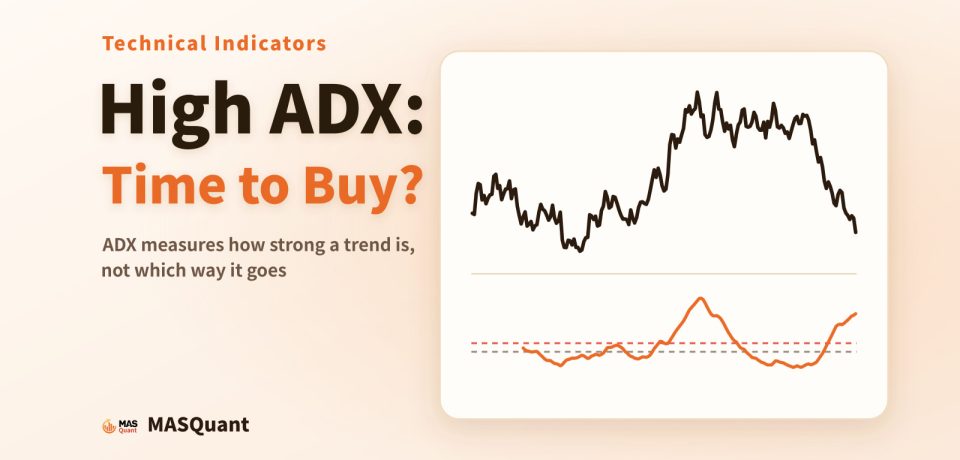
Article cover: a simplified chart of EUR/USD in 2017–2018 with the ADX line below, titled "High ADX: Time to Buy?"
CFD MASQuant Technical Analysis Technical Indicator
Oct 15, 2026

What Is the ADX Indicator? Should You Go Long When ADX Is High? It Measures Strength, Not Direction

Read More
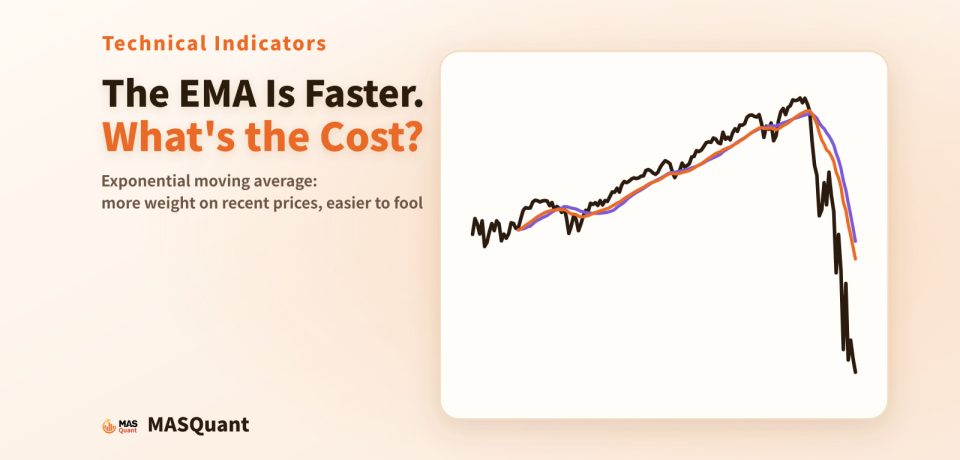
Article cover: a simplified chart of the S&P 500 from 2019 to 2020 with EMA20 and SMA20, titled "The EMA Is Faster. What's the Cost?"
CFD MASQuant Technical Analysis Technical Indicator
Oct 15, 2026

What Is an EMA? The Exponential Moving Average Is Faster, but What Does That Cost?

Read More
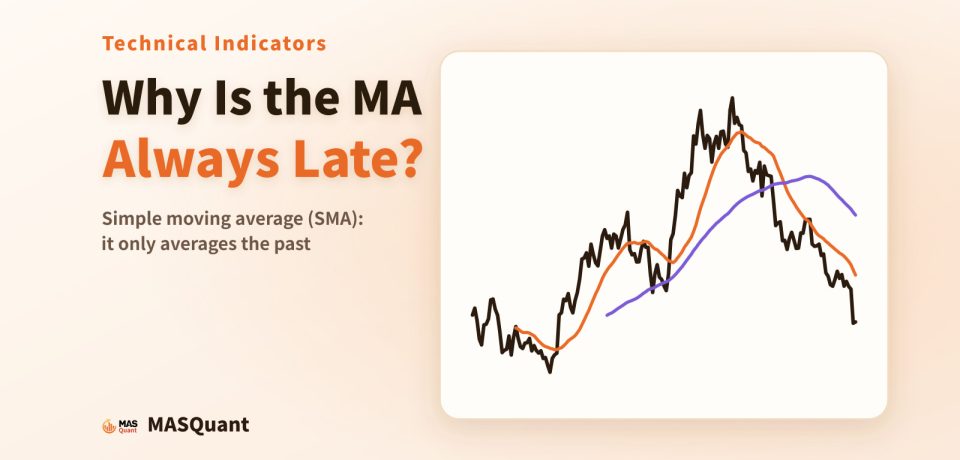
Article cover: a simplified chart of Bitcoin's 2021 daily closes with the 20-day and 60-day moving averages, titled "Why Is the MA Always Late?"
CFD MASQuant Technical Analysis Technical Indicator
Oct 15, 2026

What Is a Simple Moving Average (SMA)? Why Moving Averages Are Always a Step Behind

Read More
topic16-kd-golden-cross
CFD Golden Cross MASQuant Moving Average Risk Management Stochastic Oscillator Technical Analysis
Sep 28, 2026

Should You Buy on a KD Golden Cross? The KD Indicator Is Faster Than Moving Averages — and Fools You More Often

Read More
topic14-macd
CFD Divergence MACD MACD Divergence MASQuant Technical Analysis Technical Indicator
Sep 28, 2026

Does MACD Divergence Always Mean a Reversal? Divergence Is a Clue, Not a Verdict

Read More
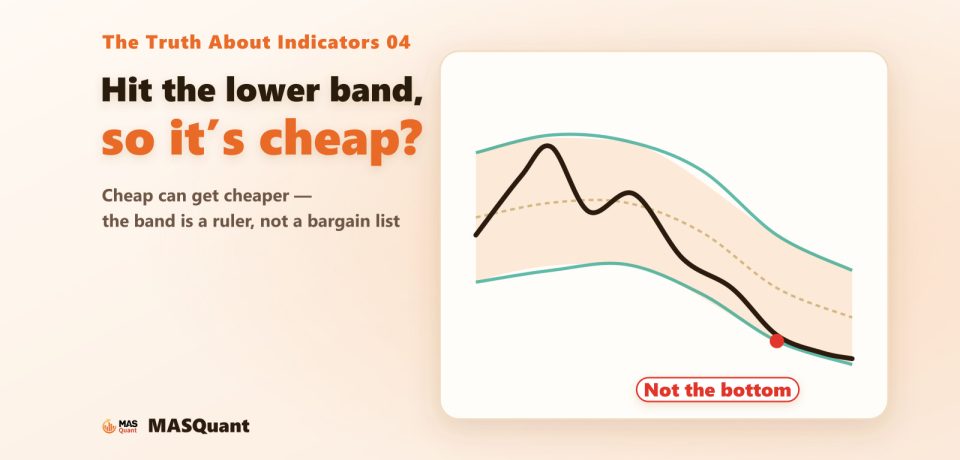
Light cover: Hit the lower band, so it’s cheap? Cheap can get cheaper. Bollinger Bands on the right, price sliding along the lower band, labelled “Not the bottom”
Bollinger Bands CFD MASQuant Technical Analysis Technical Indicator
Sep 28, 2026

How to Read Bollinger Bands? Touching the Lower Band Doesn’t Mean Cheap — Cheap Can Get Cheaper

Read More
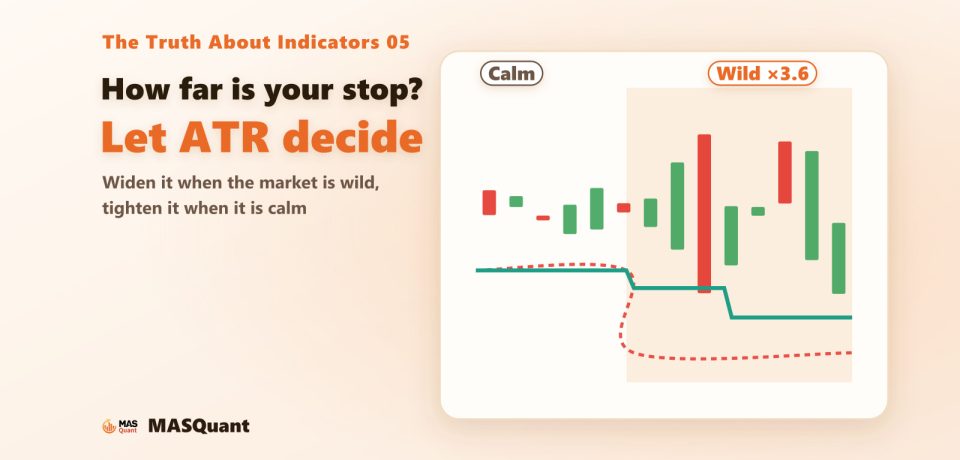
Light cover: How far is your stop? Let ATR decide. On the right, the same market is calm at first and wild later, with a stop line that widens with ATR
ATR CFD MASQuant Position Size Risk Management Stop Loss Technical Analysis
Sep 28, 2026

What Is the ATR Indicator? It Doesn’t Call Buys or Sells, but It Sets Your Stop Distance and Position Size

Read More

Search

Recent Posts

Article cover: a simplified chart of USD/JPY in 2022 with the HMA and the SMA, titled "Hull MA (HMA): The Cost of No Lag"
Oct 27, 2026

What Is the Hull Moving Average (HMA)? Almost No Lag, at the Cost of Overshooting

Article cover: a simplified chart of Ethereum in 2025 with the ZigZag line, titled "ZigZag: Why It Repaints"
Oct 27, 2026

What Is the ZigZag Indicator? Why the Highs and Lows It Draws Get Redrawn

Article cover: a simplified chart of silver in 2024, titled "Fibonacci: Why So Accurate?"
Oct 27, 2026

What Is Fibonacci Retracement? Why 61.8% Always Seems So Accurate

Popular Tags

AI Trading (8) Anchored VWAP (1) ATR (1) Automated Trading (8) Backtest (1) Bollinger Bands (1) Central Bank Rates (1) CFD (39) CFD Trading (1) CVD (1) Divergence (1) EA Trading (6) Fed (1) Federal Reserve (1) Leverage (3) MACD (1) MACD Divergence (1) Margin (3) Margin Call (1) Market Structure (1) MASQuant (45) Monetary Policy (1) MT5 (7) Negative Balance Protection (2) Order Unit (1) Pip Value (1) Position Size (2) Quantitative Trading (9) Quant Strategy (6) Rate Cut (1) Rate Hike (1) Risk Management (13) Smart Money Concepts (1) SMC (1) Spread (1) Stochastic Oscillator (1) Stop Loss (2) Swap Fee (1) Technical Analysis (30) Technical Indicator (28) Trading Bot (6) Trading Costs (2) Trading Strategy (1) TradingView (1) Volume Profile (1)

Search here

MASQuant

Terms & Policies

  • Terms of Use
  • Privacy Policy / GDPR
  • Risk Disclosure
  • Cookie Policy

Work With Us

  • Partnerships
MetaTrader 5

CFDs are high-risk financial instruments that may result in rapid loss of capital. Past performance does not guarantee future results. All strategies and backtests are for reference only and do not constitute investment advice. Please read our Risk Disclosure carefully before trading.


MASQuant © 2026 by Mas Intelligent Technology Ltd.

We use cookies to understand how the site is used and to provide live chat. You can accept or decline; declining will not affect browsing. Cookie Policy