
What Are Pivot Points? Do R1 and S1 Really Hold?
“The price touched S1 and bounced. Pivot points are spot on.”
Pivot points do get touched a lot, but that is exactly the problem. PP is calculated from the previous day’s prices, so it sits close to today’s price to begin with. We analysed 9 instruments and 27,705 trading days since 2015: PP is touched on 75.9% of days; on days that touch R1, the close ends up back below R1 48.2% of the time and above R1 51.8% of the time. Holding and breaking through are close to fifty-fifty. This article first works out the levels once, then looks at the statistics, and finally uses a real chart marked 1 to 5 (EUR/USD, January 2025) to see how five consecutive days each played out.
This article is part of MASQuant’s “Trading Academy · Technical Indicators” series. All the indicators are sorted by category in Technical Indicators: The Complete Guide.
In one sentence
Pivot points = a few reference lines for today, calculated from yesterday’s high, low and close.
PP is the centre; above it are the resistance levels R1 and R2, below it the support levels S1 and S2. They don’t change during the day.
Pivot points are like a weather forecast that says “today’s temperature will be roughly 25 to 31 degrees”: a range for today worked out from yesterday’s data, known before the market opens. The range is a useful reference, but it doesn’t mean today can’t go above 31 degrees. It tells you “where people are likely to be watching”, not “where the price will stop”.
Work it out once: five lines in a minute
Suppose yesterday’s high was 110, the low 100 and the close 106 (the following are round numbers made up for the example, not market data):
| Line | Calculation | Today’s level |
|---|---|---|
| PP (centre) | (110 + 100 + 106) ÷ 3 | 105.33 |
| R1 | 2 × 105.33 − 100 | 110.67 |
| S1 | 2 × 105.33 − 110 | 100.67 |
| R2 | 105.33 + (110 − 100) | 115.33 |
| S2 | 105.33 − (110 − 100) | 95.33 |
Notice where PP sits: it is the average of yesterday’s three prices, so it usually lands inside yesterday’s range, not far from yesterday’s close. As long as today opens near yesterday’s close and moves a little, it can easily touch PP. R1 and S1 sit roughly around yesterday’s high and low; R2 and S2 are pushed further out by the whole of yesterday’s high-low range.
The formula
This is the most common version, the classic pivot point (Classic / Floor Pivot):
PP = (yesterday's high + yesterday's low + yesterday's close) ÷ 3
R1 = 2 × PP − yesterday's low
S1 = 2 × PP − yesterday's high
R2 = PP + (yesterday's high − yesterday's low)
S2 = PP − (yesterday's high − yesterday's low)
Pivot points were originally used by floor traders on exchanges, who could work them out with pen and paper before the open. There are other methods too, such as Woodie, Camarilla and Fibonacci, which place the lines differently. You can also use the previous week’s or month’s data to calculate weekly or monthly pivot points.
MT5 doesn’t have them built into its indicator list, but the Free Indicators folder that comes with the installation includes Pivot Channel (daily classic pivot points, drawing PP, R1, R2, S1 and S2), which works only on timeframes below daily. Pay special attention: “yesterday” is cut according to the platform’s server time, and since platforms cut their daily candles differently, the pivot points they calculate will differ too.
Statistics: how often are R1 and S1 touched?
We took 9 instruments from MT5’s historical prices (gold, silver, the S&P 500, Germany 40, EUR/USD, GBP/USD, USD/JPY, Bitcoin and Ethereum), from 2015 to August 2026, 27,705 trading days in total. For each day we calculated the pivot points from the previous day’s high, low and close, then looked at that day’s high, low and close:
| What happened that day | Share of all trading days |
|---|---|
| Touched PP | 75.9% |
| Touched R1 | 44.0% |
| Touched S1 | 40.8% |
| Touched at least one of R1 and S1 | 75.1% |
| Touched both R1 and S1 | 9.8% |
| Touched neither R1 nor S1 (stayed between S1 and R1 all day) | 24.9% |
| Touched R2 | 18.5% |
| Touched S2 | 17.7% |
Then, what happened after the touch: on days that touched R1, the close fell back below R1 48.2% of the time and stayed above R1 51.8% of the time; on days that touched S1, the close got back above S1 51.1% of the time and stayed below S1 48.9% of the time. “Holding after a touch” and “breaking through after a touch” are about equally likely. Calculated for each of the nine instruments separately, the share of days touching PP was between 74% and 78% for every one of them, a very consistent result.
So when people say “the price touched S1 and bounced, pivot points are spot on”, a big part of the reason is that these lines are drawn where the price is very likely to go anyway, and which way it heads after the touch is close to fifty-fifty.
Read the chart: EUR/USD in January 2025, following 1 to 5
The chart below shows EUR/USD (EURUSD) hourly candles over five consecutive trading days, from 9 to 15 January 2025, taken from MT5’s historical prices. Each day’s PP, R1 and S1 are calculated from the previous day’s daily candle, so the lines change every day. These five days happen to show one pattern each.
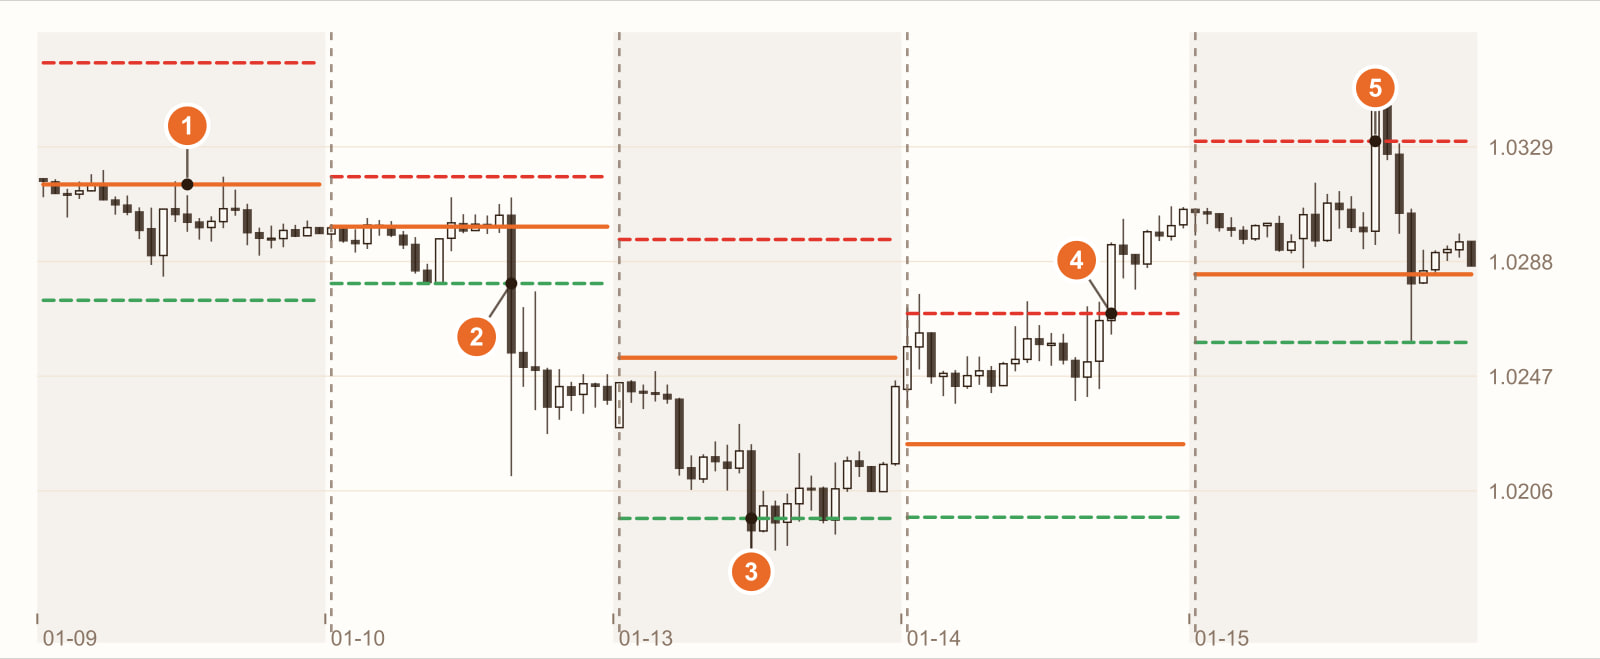
Between S1 and R1 all day (9 January). The day’s high was 1.03206 and the low 1.02826, so it touched neither R1 (1.03587) nor S1 (1.02742); the price just circled around PP (1.03155). Statistically, about one day in four looks like this.
Broke below S1 and closed below it (10 January). In the afternoon a long bearish candle broke below S1 (1.02802), and the day finally closed at 1.02387, well below S1. The “support” did not hold.
Touched S1, closed back above it (13 January). The day’s low reached 1.01765, below S1 (1.01966), but the close recovered to 1.02435, above S1. This is what people call “S1 held”.
Broke above R1 and closed above it (14 January). The price pushed up through R1 (1.02695) and closed at 1.03066. The “resistance” did not hold the price back.
Touched R1, closed back below it (15 January). The day’s high reached 1.03533, above R1 (1.03308), but it closed at 1.02864, back below R1. This is “R1 acting as resistance”.
Over the five days, support held once and resistance held once, there was one breakout and one breakdown, and one day touched neither side. In hindsight, every line “got a reaction”; but at the moment the price touches a line, you don’t know which kind of day it is.
This is a real stretch of historical prices, used to show how pivot points behave. It is not a general rule. Change the instrument, the timeframe or the period, and every number will change.
What you see, what it means
| What you see | What it usually means | But be careful |
|---|---|---|
| Price above PP | Today is stronger than yesterday’s average price | PP is touched on 75.9% of days; crossing above and below it is common |
| Price touches R1 | Today has reached about yesterday’s high | Closing back below and closing above are roughly fifty-fifty (48.2% vs 51.8%) |
| Price touches S1 | Today has reached about yesterday’s low | Same as above (51.1% vs 48.9%) |
| Between S1 and R1 all day | Today is not very volatile | About once every four days (24.9%) |
| Price touches R2 or S2 | Today is very volatile | About once every five or six days (18.5%, 17.7%) |
How to use it: three examples
Example 1: as reference levels, not entry signals
What makes pivot points most useful is that before the market opens, you already know roughly which levels people will be watching today. You can use them to plan where to put stop-losses and take-profits, rather than “reverse as soon as it touches”.
Example 2: wait for the reaction after the touch, then decide direction
After a touch of R1, holding and breaking through are roughly evenly split, so you can wait for the market to show its hand: “After the price touches R1, go short only if a later hourly candle closes back below R1; if it closes above R1, don’t go short.” Confirming with a close cuts the guesswork in half compared with entering on the touch.
Example 3: use R2 and S2 as a “today has gone a long way” reminder
Fewer than two days in ten touch R2 or S2. If the price has already reached R2, today’s gain is much bigger than usual; treat it as a reminder to “tighten your take-profit first”, not as a reason to go short straight away.
All three examples come back to one thing: pivot points are reference lines drawn from yesterday’s data. They tell you where people are likely to look, not where the price will turn.
Common mistakes
1. Buying at S1 and selling at R1
Statistically, after touching R1 the close falls back below it only 48.2% of the time and stays above it 51.8% of the time. Relying on “reverse on the touch” alone is betting on a coin flip.
2. Using “the price often touches pivot points” as proof that they work
PP is touched on 75.9% of days because it is drawn in the middle of yesterday’s range, close to today’s price. Being touched often doesn’t mean the price turns after the touch.
3. Comparing pivot points across platforms
“Yesterday” is cut according to each platform’s server time, so each platform’s daily high, low and close differ, and so do the pivot points. Switch platforms and the lines may sit some distance apart.
FAQ
What are pivot points?
Pivot points use the previous period’s high, low and close to calculate this period’s central price, PP, along with the resistance levels R1 and R2 above and the support levels S1 and S2 below. The most common use is daily pivot points calculated from the previous day’s data.
How are pivot points calculated?
PP = (yesterday’s high + low + close) ÷ 3; R1 = 2 × PP − yesterday’s low; S1 = 2 × PP − yesterday’s high; R2 and S2 are PP plus and minus yesterday’s high-low range.
Are pivot points accurate?
Across 27,705 trading days on 9 instruments since 2015, PP was touched on 75.9% of days, and after a touch of R1 the close fell back below it 48.2% of the time. Being touched is common, and which way the price goes after the touch is close to fifty-fifty, so it is best to combine them with other conditions or a backtest.
Does MT5 have pivot points?
They are not built into the MT5 indicator list, but the Free Indicators folder that comes with the installation includes Pivot Channel (daily classic pivot points), which works only on timeframes below daily. Daily candles are cut according to the platform’s server time.
Conclusion
The advantage of pivot points is that you know where today’s reference lines are before the open; their limitation is that these lines sit close to the price, so being touched is normal, and which way the price goes after the touch is close to fifty-fifty.
So the real question is: on your instrument, how different are the results of “go short only after touching R1 and closing back below it” and going short as soon as it touches? One stretch of historical prices cannot answer that; you need to backtest the rule across many stretches of the market.
No rules of your own yet, and don’t want to piece them together one indicator at a time? With MASQuant’s Strategy Genie, you just pick an investment style first; the AI analyses market conditions, selects instruments and gives you three candidate strategies at once. Each one has already been backtested on historical data, with its returns and maximum drawdown of capital laid out in full, and then you decide whether to deploy it to MT5.
If you already have an idea of your own, write the condition as one sentence, for example “on the hourly chart, go short only when the price touches the day’s R1 and closes back below R1, with the stop-loss above the day’s high”, give it to the AI Strategy Assistant, and press go to start the backtest. The backtest environment includes real market frictions such as spreads, slippage, changes in market liquidity and execution delays (see the AI Strategy Assistant guide for how to use it). Then change the condition to “go short as soon as R1 is touched” and run it again, and you will see whether waiting for a closing confirmation is worth it. A backtest tells you “how this rule performed in past market conditions”, not a guarantee about the future.
An idea only becomes a strategy once it’s been tested.
The price chart in this article is taken from historical prices on the MT5 platform (hourly; the pivot points are calculated from the same platform’s daily candles), and the statistics use daily candles from January 2015 to August 2026 for 9 instruments on the same platform (gold, silver, the S&P 500, Germany 40, EUR/USD, GBP/USD, USD/JPY, Bitcoin and Ethereum). Daily candles are cut according to the platform’s server time; platforms cut them differently, so the pivot points they calculate will differ too. Historical prices are used only to show how the indicator behaves and do not represent future price movements.
Risk disclosure: CFDs are high-risk financial products and can lead to rapid loss of capital. Past performance does not guarantee future results. All strategies and backtests are for reference only and do not constitute investment advice. Please read our Risk Disclosure carefully before trading.


