
What Is Fibonacci Retracement? Why 61.8% Always Seems So Accurate
“It stopped at 61.8% again! The golden ratio really works.”
Looking back at a chart, a pullback often stops right next to one of the Fibonacci lines. The reason is simple: the five lines at 23.6%, 38.2%, 50%, 61.8% and 78.6% slice the range where pullbacks most often stop into very fine pieces, so wherever a pullback stops, it is never far from one of them. This article first works through the numbers once with round figures, then uses a real chart marked 1 to 5 (silver, 2024) to look at a pullback that was “spot on in hindsight”, and finally uses statistics on 764 pullbacks across 9 instruments to see whether 61.8% is really special.
This article is part of MASQuant’s “Trading Academy · Technical Indicators” series. All the indicators are sorted by category in Technical Indicators: The Complete Guide.
In one sentence
Fibonacci retracement = a few lines drawn at fixed ratios between the start and the end of a rise (or a fall).
The question it answers: “If the price pulls back, at what fraction of the rise might it stop?” It does not answer “which line it will stop at”.
Fibonacci retracement is like planting flags along a 100-metre road: one at 23.6 metres, one at 38.2 metres, one at 50 metres, one at 61.8 metres and one at 78.6 metres. Wherever someone stops, there is almost always a flag nearby. Saying “he stopped next to a flag” afterwards is easy; saying beforehand “which flag he will stop at” is the hard part.
Work it out once: a rise from 100 to 200
Suppose a rally goes from 100 to 200, a gain of 100 (the following are round numbers made up for the example, not market data). Retracement ratios are measured back down from the high:
| Retracement ratio | Calculation | Price level |
|---|---|---|
| 23.6% | 200 − 100 × 0.236 | 176.4 |
| 38.2% | 200 − 100 × 0.382 | 161.8 |
| 50% | 200 − 100 × 0.5 | 150.0 |
| 61.8% | 200 − 100 × 0.618 | 138.2 |
| 78.6% | 200 − 100 × 0.786 | 121.4 |
The five lines run from 176.4 down to 121.4, and neighbouring lines are only 11.8 to 16.8 apart. As long as the price pulls back to anywhere between 121.4 and 176.4, it is never more than 8.4 away from the nearest line.
The formula
Retracement level in a rise = high − (high − low) × ratio
Bounce level in a fall      = low + (high − low) × ratio

Common ratios: 23.6%, 38.2%, 50%, 61.8%, 78.6%
The ratios come from the Fibonacci sequence (1, 1, 2, 3, 5, 8, 13, 21…): divide one number by the next and you get close to 0.618 (the golden ratio); skip one and you get close to 0.382; skip two and you get close to 0.236. 50% is not a Fibonacci ratio; traders added it out of habit. 78.6% is the square root of 0.618.
In MT5, Fibonacci retracement is a drawing tool, not an indicator: choose Fibonacci Retracement from Insert → Objects → Fibonacci, drag on the chart from the low to the high, and the lines for each ratio are drawn; you can add or remove ratios yourself. Where the lines go depends on which low and which high you pick: on the same chart, different people may draw different lines.
Read the chart: silver in 2024, following 1 to 5
The chart below shows silver (XAGUSD) on the daily timeframe from mid-April to early August 2024, taken from MT5’s historical prices. From 2 May to 20 May, silver rose from 25.997 to 32.486, a gain of 25% in 12 bars. It then pulled back and stopped at 28.547 on 26 June, having retraced 60.7% of that rise, just short of the 61.8% line.
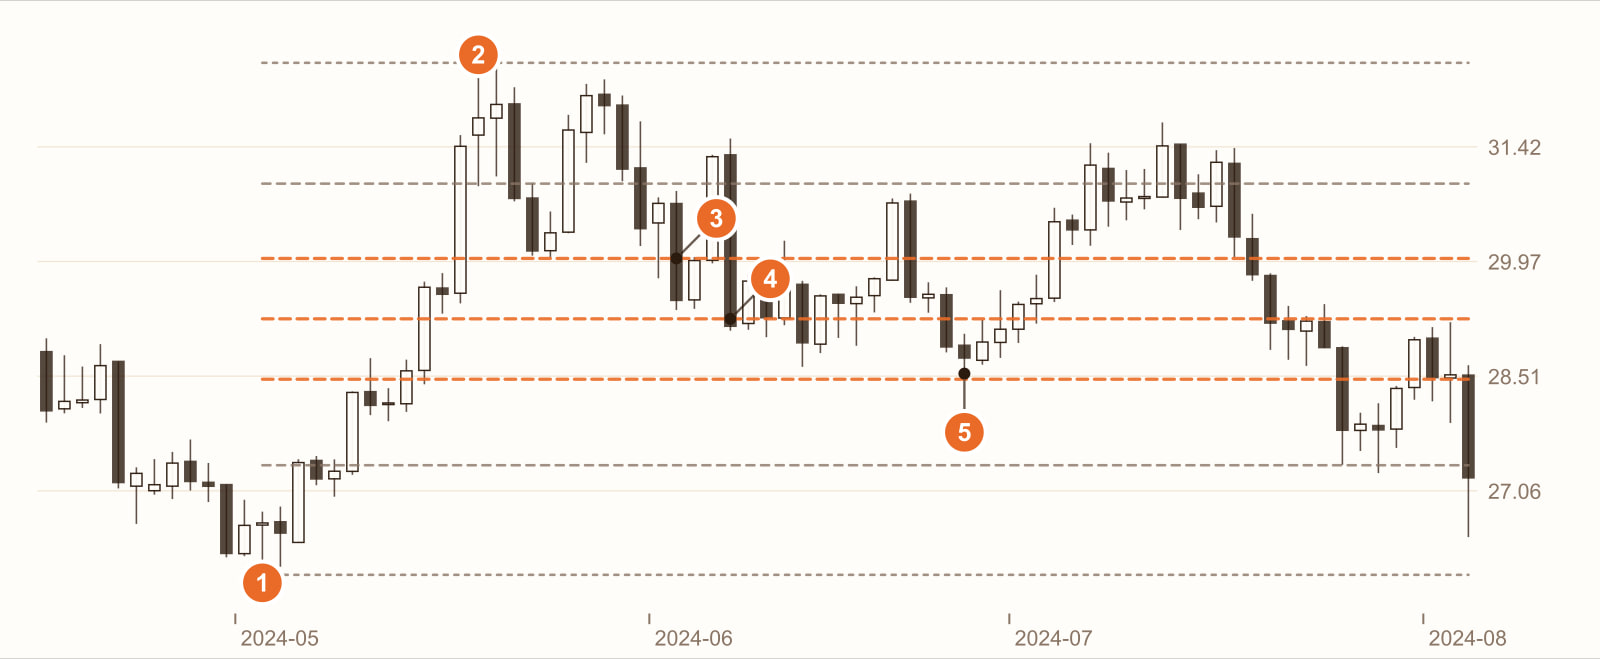
Start of the rise: 2 May 2024, low 25.997.
End of the rise: 20 May, high 32.486. Drawing the Fibonacci retracement between these two points puts 38.2% at 30.007, 50% at 29.242 and 61.8% at 28.476.
A close below 38.2% (4 June, close 29.475). If you believed “38.2% will hold” and bought around here, the price still had to fall another 3.1% before it bottomed.
A close below 50% (7 June, close 29.147). The second line did not hold either; from here, the price still fell another 2.1%.
The fall stops near 61.8% (26 June, low 28.547). After retracing 60.7%, the price bounced until 11 July, recovering a distance equal to 44.5% of the earlier rise. In hindsight, 61.8% was “spot on”. But at the time of 3 and 4, 38.2% and 50% looked just as much like support. You only find out which line it was afterwards.
This is a real stretch of historical prices, used to show how Fibonacci retracement behaves. It is not a general rule. Change the instrument, the timeframe or the period, and every number will change.
The statistics: where do pullbacks stop?
One example proves very little, so we looked at the statistics. Using the ZigZag(12, 5, 3) that comes with MT5, we cut the daily charts of 9 instruments (gold, silver, the S&P 500, Germany 40, EUR/USD, GBP/USD, USD/JPY, Bitcoin and Ethereum) since 2015 into a series of pushes and pullbacks, then calculated what percentage of the previous push each pullback retraced.
Start with one number: out of 1,477 pullbacks, 713 (48.3%) went straight past 100%, meaning they broke below (or above) the starting point of the push, and none of the five lines held. For the remaining 764 pullbacks that retraced less than 100%, the ratios were distributed like this:
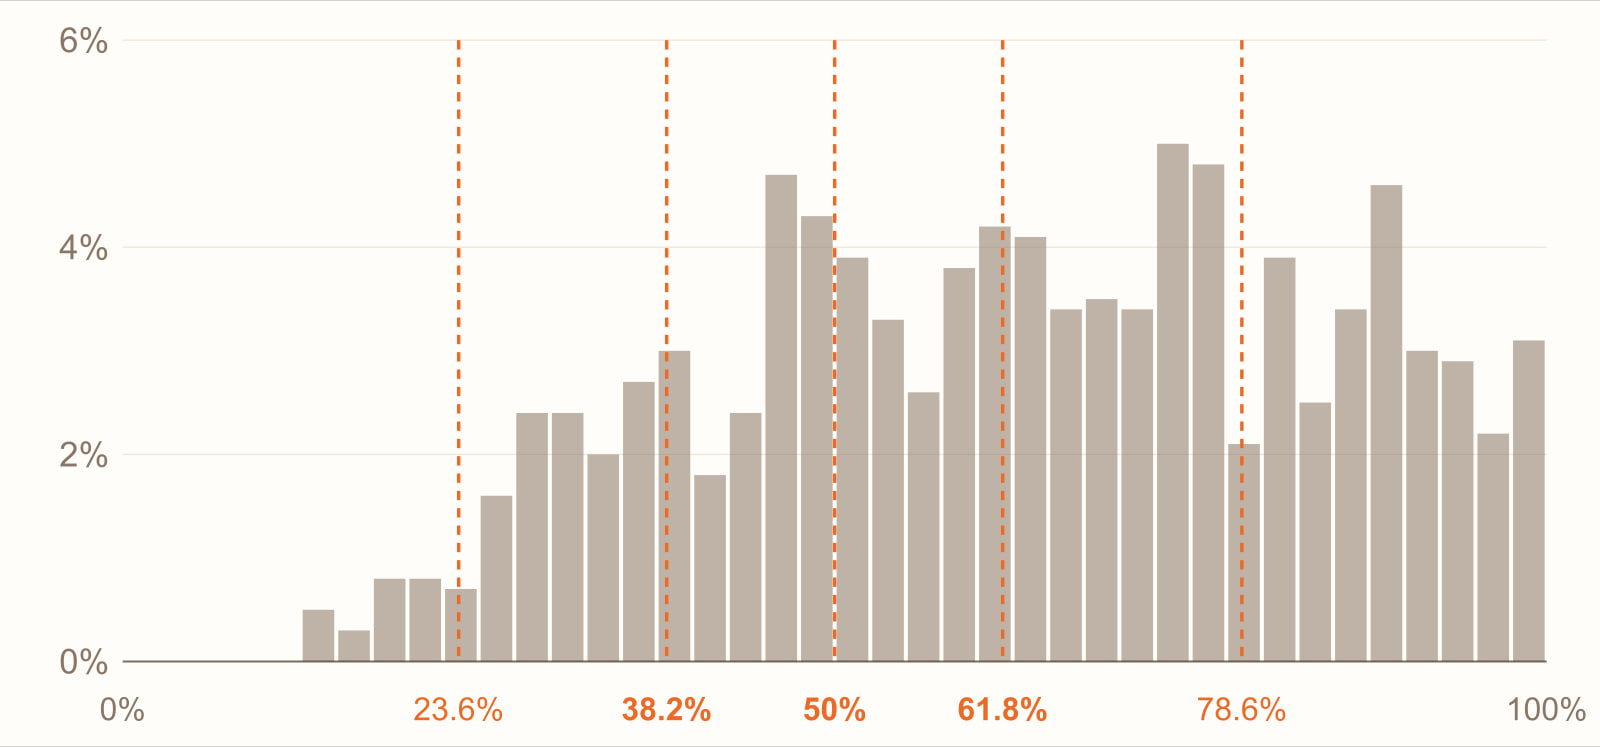
If 61.8% were really special, its bin should stand out clearly above its neighbours. The actual numbers are:
| Retracement ratio falls around… (2.5 percentage points either side) | Share of the 764 |
|---|---|
| Around 38.2% | 5.9% |
| Around 45% (not a Fibonacci ratio) | 7.1% |
| Around 50% | 8.2% |
| Around 55% (not a Fibonacci ratio) | 5.9% |
| Around 61.8% | 8.2% |
| Around 65% (not a Fibonacci ratio) | 7.5% |
| Around 70% (not a Fibonacci ratio) | 6.9% |
Around 61.8% there is 8.2%, and around 65% right next to it there is 7.5%: about the same. Now take the five lines together: 2.5 percentage points either side of 23.6%, 38.2%, 50%, 61.8% and 78.6% covers 31.2% of all pullbacks; shift the whole set of five lines up by 5 percentage points and it still covers 27.6%; shift it down by 5 percentage points and it covers 26.8%; replace it with evenly spaced lines at 20%, 35%, 50%, 65% and 80% and it covers 28.0%.
The Fibonacci set catches slightly more, but the gap is only 3 to 4 percentage points. The main reason the five lines are “often accurate” is that they cover the wide band where pullbacks most often stop. The median retracement ratio is 63.5%, and 31.7% of pullbacks fall between 38.2% and 61.8%.
What you see, what it means
| What you see | What it usually means | But be careful |
|---|---|---|
| A pullback stops near one of the lines | In hindsight, that line “reacted” | The five lines are packed closely, so wherever a pullback stops, it is never far from one of them |
| The price breaks below 38.2% | The pullback is fairly deep | There are still 50%, 61.8% and 78.6% below, and each of them could be called support (3 and 4 on the chart) |
| The price breaks below 100% (the starting point of the push) | The whole push has been wiped out | With legs cut by ZigZag(12), almost half of all pullbacks do this (48.3%) |
| A Fibonacci line coincides with a previous high or low | There are several reasons for this price level to draw attention | An overlap is more useful than a single line, but it is no guarantee either |
| Pick a different high and low, and the lines change | Fibonacci depends on how you draw it | When backtesting, spell out “which high and which low” |
How to use it: three examples
Example 1: treat it as a “possible stopping zone”, not a single price
Rather than betting on the 61.8% line alone, treat 38.2% to 61.8% as one zone and wait inside it for the price to show its hand, for example “only enter after a candle that closes near the day’s high”.
Example 2: always pair it with a stop-loss
If you enter at one line, put the stop-loss beyond the next one. On the chart, if you had bought around 38.2% with a stop below 50%, you would have been stopped out around 4; with the stop below 61.8%, you would have made it through 5, because the low at 5, 28.547, stayed just above the 61.8% level of 28.476. Where to put the stop is something to backtest on your own instrument, not something to decide by which line seems more magical.
Example 3: look for overlaps with other price levels
When a Fibonacci line happens to coincide with a previous high, a round number or a pivot point, there are more reasons for that price level to draw attention (for statistics on pivot points, see What are pivot points?). An overlap is no guarantee, but it is easier to explain than a single line on its own.
All three examples have to accept the same thing: Fibonacci lines are a ruler with very fine markings. It is handy for measuring how deep a pullback is; for predicting where a pullback will stop, let a backtest do the talking.
Common mistakes
1. Finding an accurate example after the fact and assuming it would have worked beforehand
On the chart, silver stopped falling at 61.8%, but before that it had already broken below 38.2% and 50%. After the fact, someone will always say that each line “held”; beforehand, you cannot know which one it will be.
2. Believing 61.8% has some special magic
Among the 764 pullbacks, 8.2% stopped around 61.8%, 7.5% around 65% and 8.2% around 50%. 61.8% does not stand out from its neighbours.
3. Picking the high and low casually
Which low you drag from and which high you drag to changes the position of the lines completely. Without a fixed rule (for example “use highs and lows only once ZigZag has confirmed them”), it is easy to unconsciously pick a version that “looks accurate”.
FAQ
What is Fibonacci retracement?
Fibonacci retracement draws reference price levels at ratios such as 23.6%, 38.2%, 50%, 61.8% and 78.6% between the start and end of a rise or a fall, to estimate what fraction of the move a pullback might give back before it stops.
How do you draw Fibonacci retracement?
In a rise, drag from the low to the high; in a fall, drag from the high to the low. In MT5, choose Fibonacci Retracement from Insert → Objects → Fibonacci and drag on the chart, and the lines for each ratio are drawn.
Is 61.8% really more accurate?
In our statistics on 764 pullbacks that retraced less than 100%, across 9 instruments since 2015, 8.2% stopped within 2.5 percentage points of 61.8%, while 7.5% stopped near 65% and 8.2% near 50%. 61.8% does not stand out.
Is Fibonacci retracement an indicator?
In MT5 it is a drawing tool, not an indicator: where the lines go depends on the high and low you choose, and they do not update themselves as prices move.
Conclusion
Fibonacci retracement is a handy ruler: one glance tells you how deep a pullback is. It looks accurate mainly because its markings are so close together.
So the real question is: on your instrument, does “buy only after a pullback to around 61.8%” really give different results from “buy only after a pullback to around 50% or 65%”? One stretch of historical prices cannot answer that; you need to backtest the rule across many stretches of the market.
No rules of your own yet, and don’t want to piece them together one indicator at a time? With MASQuant’s Strategy Genie, you just pick an investment style first; the AI analyses market conditions, selects instruments and gives you three candidate strategies at once. Each one has already been backtested on historical data, with its returns and maximum drawdown of capital laid out in full, and then you decide whether to deploy it to MT5.
If you already have an idea of your own, write the condition as one sentence, for example “go long only when the price has pulled back to between 50% and 61.8% of the previous rise and closes near the day’s high, with the stop-loss below 78.6%”, give it to the AI Strategy Assistant, and press go to start the backtest. The backtest environment includes real market frictions such as spreads, slippage, changes in market liquidity and execution delays (see the AI Strategy Assistant guide for how to use it). Then change the zone to 45% to 65% and run it again, and you will see whether the Fibonacci ratios are really any more special. A backtest tells you “how this rule performed in past market conditions”, not a guarantee about the future.
An idea only becomes a strategy once it’s been tested.
The price chart in this article is taken from historical prices on the MT5 platform (daily; quotes and daily candle cut-off times differ slightly between platforms, so values may not match exactly). The retracement statistics use daily data from the same platform for 9 instruments (gold, silver, the S&P 500, Germany 40, EUR/USD, GBP/USD, USD/JPY, Bitcoin and Ethereum), cut into pushes and pullbacks with the ZigZag(12, 5, 3) that comes with MT5; only pushes whose high came in January 2015 or later, and that were confirmed afterwards, are counted. With different ZigZag parameters, the legs and the ratios would also be different. The round numbers in the example are not market data. Historical prices are used only to show how the indicator behaves and do not represent future price movements.
Risk disclosure: CFDs are high-risk financial products and can lead to rapid loss of capital. Past performance does not guarantee future results. All strategies and backtests are for reference only and do not constitute investment advice. Please read our Risk Disclosure carefully before trading.


