
What Is the CCI Indicator? Is CCI Above 100 Overbought? An Oscillator With No Ceiling
“CCI is above 100, it’s overbought, time to sell, right?”
CCI’s ±100 lines are often treated as overbought and oversold lines, but CCI differs from RSI in one fundamental way: CCI has no upper or lower limit. RSI tops out at 100; CCI can shoot to 200, 300 or even higher. This article first works it out once with 5 numbers, and you will find that +100 actually means something quite plain; then it uses a real chart marked 1 to 4 (gold, 2025) to show its two faces, in a range and in a trend.
This article is part of MASQuant’s “Trading Academy · Technical Indicators” series. All the indicators are sorted by category in Technical Indicators: The Complete Guide.
In one sentence
CCI = how far the current price is from its recent average, as a multiple of the “usual distance”.
The question it answers: “Is the price further away than usual right now, and by how much?” It does not answer “will it come back?”
Think of taking your temperature. Your normal temperature varies by less than 0.2 degrees; if today it is 0.3 degrees above normal, that is 1.5 times the usual variation, which is roughly what a CCI of 100 means. A raised temperature does not mean the fever will break tomorrow; a fever can last for days. Price is the same: once it has moved further from the average than usual, it can stay far away.
Work it out once: five numbers are enough
CCI first works out a representative price for each candle, called the typical price: (high + low + close) ÷ 3. Below we use the typical prices of the last 5 candles (these are round numbers made up for the example, not market data; in practice 20 candles are common):
The typical prices of the last 5 candles are 100, 102, 101, 99, 103.
| Step | Calculation | Result |
|---|---|---|
| 1 Average price | (100 + 102 + 101 + 99 + 103) ÷ 5 | 101 |
| 2 How far each one is from the average | 1, 1, 0, 2, 2 | — |
| 3 The usual distance (mean absolute deviation) | (1 + 1 + 0 + 2 + 2) ÷ 5 | 1.2 |
| 4 How far the price is from the average now | 103 − 101 | 2 |
| 5 CCI | 2 ÷ (0.015 × 1.2) | about 111 |
In plain words: the price is now 2 away from the average, while it is usually about 1.2 away, so the current distance is 1.67 times the usual, which works out to a CCI of about 111.
The 0.015 in the formula scales “how many times” up to the CCI scale: CCI = the multiple × 66.7. So:
- CCI 100 ≈ the current distance is 1.5 times the usual
- CCI 200 ≈ 3 times the usual
- CCI −100 ≈ a downward deviation 1.5 times the usual
A “multiple” has no upper limit, so CCI has none either. The original meaning of ±100 is “further away than usual”, not “it has hit the top”.
The formula
Typical price TP = (high + low + close) ÷ 3
CCI = (TP − N-period average of TP) ÷ (0.015 × mean absolute deviation)
CCI (Commodity Channel Index; in Taiwan it is also often called the “trend-following indicator”) was introduced by Donald Lambert in 1980. 0.015 is the constant he chose so that most of the time (the commonly quoted figure is 70 to 80%) CCI falls between −100 and +100.
As for the period, the most common setting is 20; in MT5, the built-in Commodity Channel Index defaults to a period of 14, while some charting platforms default to 20. The chart in this article uses CCI(20). Different periods give different values, so check before comparing.
Read the chart: gold in 2025, following 1 to 4
The chart below shows gold (XAUUSD) on the daily timeframe from May to November 2025, taken from MT5’s historical prices. From May to July gold moved sideways, closing between 3,177 and 3,433; from August it headed higher, setting one new high after another in September.
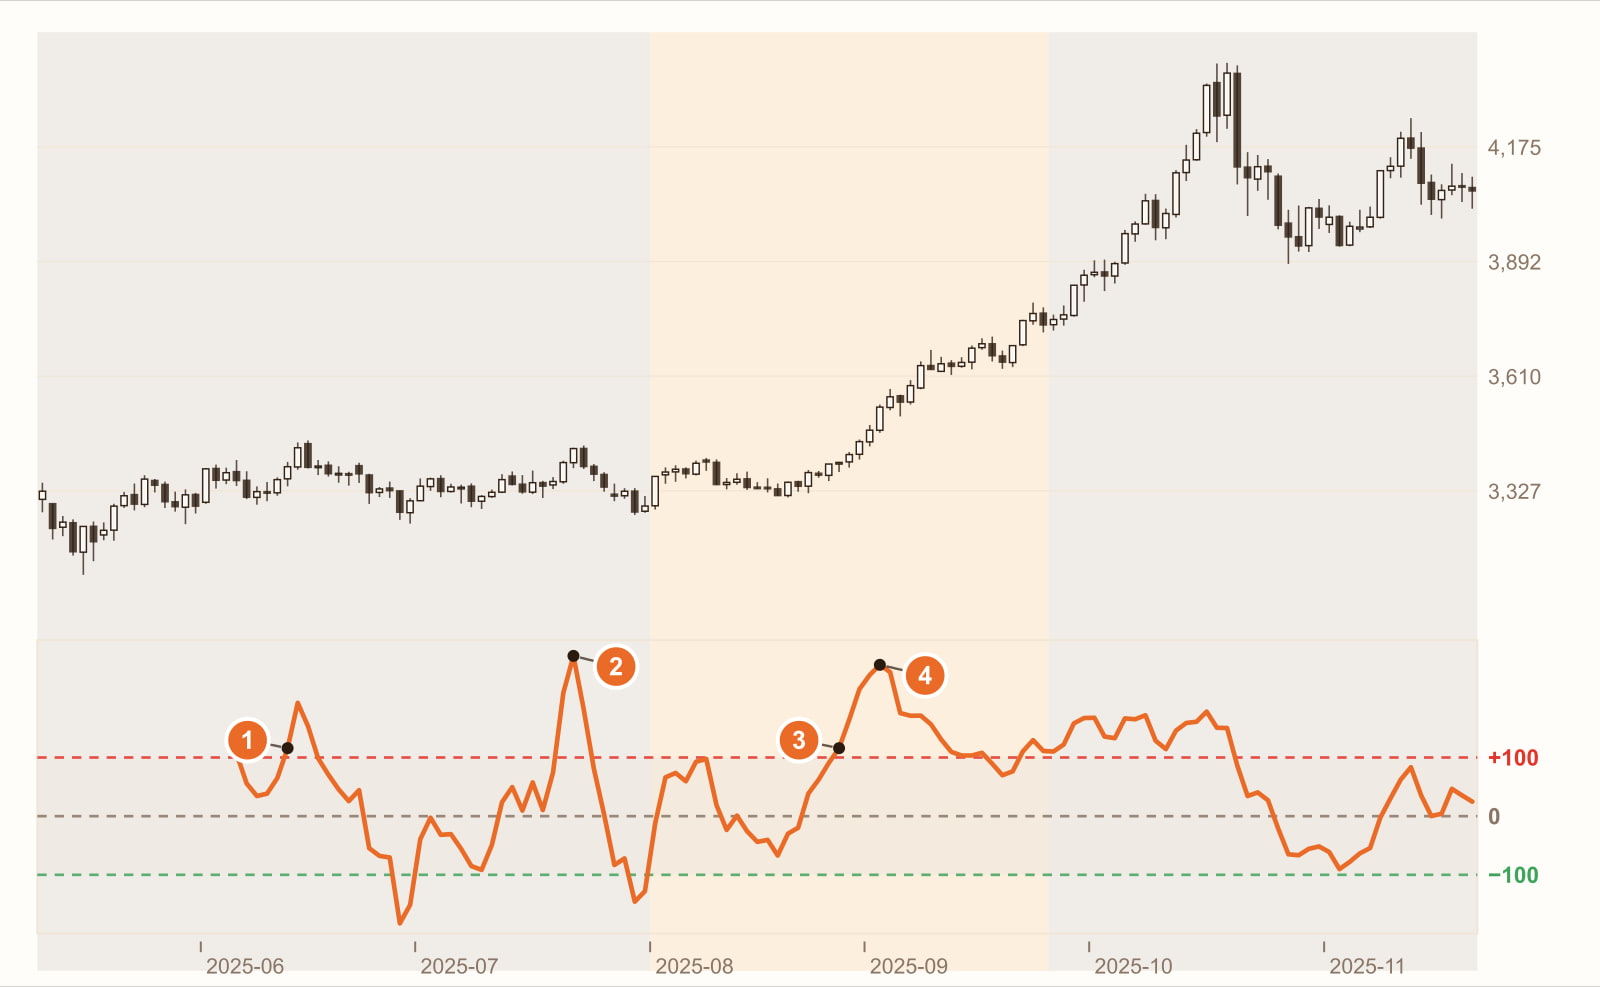
In the range, CCI rises above +100 and soon comes back (12 June). The price only reached the top of the range, yet CCI went above +100. Over the whole range, CCI went above +100 3 times and below −100 2 times; each time it came back soon after, and the price never left the range.
In the range, CCI peaks at 273 (22 July). By the calculation above, 273 means “the distance from the average is 4 times the usual”: very extreme. Yet 2 bars later it was back below +100, and the price was still inside the range. A very high CCI does not mean there is a trend.
During the rally, CCI rises above +100 (27 August). Sell here as “overbought” and what you sell is the start of the rally. Over that rally (1 August to 24 September), gold climbed from 3,363 to 3,736, a gain of 11.1%.
CCI reaches 258 (2 September). During the rally, CCI stayed above +100 for up to 15 bars in a row. 258 is about 3.9 times the usual distance: it is saying “this move is strong”, not “it is about to come back”.
Across the whole chart, CCI reached a high of 273 and a low of −183, both far beyond ±100. It really has no upper or lower limit.
This is a real stretch of historical prices, used to show how CCI behaves. It is not a general rule. Change the instrument, the timeframe or the period, and every number will change.
What you see, what it means
| What you see | What it usually means | But be careful |
|---|---|---|
| CCI moves back and forth between ±100 | The price’s distance from the average is about the same as usual | There is usually no clear direction at such times either |
| CCI rises above +100 | The price has moved further upward from the average than usual | In a range this is often the end of a move (1); in a trend it is often the start (3) |
| CCI stays above +100 for a long time | Strength: the price keeps staying far from the average | Not a selling point; it means “this move is strong” (4) |
| CCI falls back below +100 from above | The deviation is shrinking and momentum is fading | Later than acting the moment it touches +100, but you get run over less often |
| CCI stays above 0 for a long time | The price is mostly above the average, leaning bullish | Many people watch only ±100 and ignore that the zero line also tells you about direction |
How to use it: three examples
Example 1: first decide whether it is a range or a trend
The same “CCI rises above +100” is often the end of a move in a range and often the start in a trend. Lambert’s original use was actually closer to the latter: CCI rising above +100 was seen as the possible start of a new strong move. First judge the market condition from the direction of a moving average or from ADX, then decide how to read CCI.
Example 2: wait for it to “come back” before acting
Instead of selling the moment it touches +100, wait until CCI falls back below +100 from above before treating it as weakening. You will be a little later, but less likely to be run over by a market that keeps rising.
Example 3: plan your stop loss before trading against the trend
CCI has no ceiling, so “more overbought after overbought” can go much further than with RSI. Any rule that uses CCI to trade against the trend must decide in advance where to exit if you are wrong; see How to Set a Stop Loss?
Common mistakes
1. Treating +100 like RSI’s 70
RSI is capped within a 0-to-100 range; CCI is not. While CCI goes from +100 to +200, the price may climb a long way further.
2. Comparing CCI across platforms directly
MT5 defaults to 14 while other platforms may default to 20, so for the same instrument at the same time, the CCI values can differ a lot. Before using someone else’s “sell when CCI hits 150”, check their period.
3. Watching only ±100, not the zero line
CCI above 0 means the price is above its average, and below 0 means it is below. CCI staying above or below 0 for a long time is itself describing direction.
FAQ
What is the CCI indicator?
CCI (Commodity Channel Index) was introduced by Donald Lambert in 1980. It measures how far the typical price is from its N-period average, divided by the usual size of deviation. The common period is 20 (MT5’s built-in default is 14), and its values have no upper or lower limit.
Is CCI above 100 overbought?
Not necessarily. +100 roughly means “the current distance from the average is 1.5 times the usual”. In a range this is often the end of a move; in a trend, CCI can stay above +100 for a long time. Whether to treat it as overbought depends on the market condition.
What is the 0.015 in the CCI formula?
It is the constant Lambert chose; it is equivalent to multiplying “how many times the usual distance the current distance is” by 66.7. This makes most CCI values fall between −100 and +100, giving ±100 the meaning “further away than usual”.
How is CCI different from RSI?
RSI compares recent up and down momentum and is fixed between 0 and 100; CCI compares how far the price is from its average and has no limits. Both can stay at high levels during a trend. More on the RSI’s strengths and limits: How to Read the RSI Indicator?
Conclusion
CCI’s ±100 is not a ceiling; it is a reminder that the price is “further away than usual”. In a range, that reminder is often right; in a trend, the same reminder is saying “this move is strong”.
So the real question is: on your instrument, after CCI breaks above +100, does it more often come back, or more often keep going? One stretch of historical prices cannot answer that. Backtest it with our AI Strategy Assistant and you will know.
Write the condition as one sentence, for example “enter when CCI moves back above −100 from below, exit when CCI falls back from above +100”, give it to MASQuant’s AI Strategy Assistant, and press go to start the backtest. The backtest environment includes real market frictions such as spreads, slippage, changes in market liquidity and execution delays (see the AI Strategy Assistant guide for how to use it). A backtest tells you “how this rule performed in past market conditions”, not a guarantee about the future.
An idea only becomes a strategy once it’s been tested.
The price chart in this article is taken from historical prices on the MT5 platform (daily; quotes and daily candle cut-off times differ slightly between platforms, so values may not match exactly), and the indicators are calculated by a program using the standard formulas; the round numbers in the example are not market data. Historical prices are used only to show how the indicator behaves and do not represent future price movements.
Risk disclosure: CFDs are high-risk financial products and can lead to rapid loss of capital. Past performance does not guarantee future results. All strategies and backtests are for reference only and do not constitute investment advice. Please read our Risk Disclosure carefully before trading.


