
What Is Supertrend? Keeping an ATR Distance Means Fewer Flips, but Later Exits
“Supertrend works better than the SAR; it doesn’t get shaken out as much.”
That is true, but only half the story. Like the Parabolic SAR, Supertrend is a trailing stop line that flips sides; the difference is that it keeps a distance from the price using ATR, so small wobbles cannot reach it. With the distance widened, you get shaken out less often; but the same distance also makes it leave later when the trend really turns. This article first works it out once with three candles, then uses a real chart marked 1 to 4 (gold, 2024) to compare it with the SAR on the same stretch.
This article is part of MASQuant’s “Trading Academy · Technical Indicators” series. All the indicators are sorted by category in Technical Indicators: The Complete Guide.
In one sentence
Supertrend = a stop line that keeps a distance of “3 × ATR” from the price, only moves in the direction of the trend, and flips when the close breaks it.
It answers the same question as the SAR: “If I hold with the trend, where should my stop loss be?” It just places the stop further away.
Think of it as keeping a safe distance behind the car in front: when the car ahead (the price) wobbles a little, it does not reach the car behind; the messier the road (the larger the ATR), the more the gap widens automatically. The cost: when the car ahead really turns around, the car behind takes a while to react. ATR is “roughly how much each candle usually moves”; for how it is calculated, see What is the ATR indicator?
Work it out once: three candles are enough
A common setting is an ATR period of 10 with a multiplier of 3. Below we assume ATR stays at 1.5, so the distance is 3 × 1.5 = 4.5 (the following are numbers made up for the example, not market data). When long, Supertrend is the line “4.5 below the midline”:
| When | High / low | Midline = (high + low) ÷ 2 | This bar’s lower band = midline − 4.5 | Supertrend |
|---|---|---|---|---|
| Bar 1 | 106 / 104 | 105 | 100.5 | 100.5 |
| Bar 2 | 107 / 105 | 106 | 101.5 | 101.5 (higher, so it moves up) |
| Bar 3 | 105 / 103 | 104 | 99.5 | 101.5 (lower, so it is not allowed to step back) |
The key is bar 3: the price pulls back and the calculated lower band drops to 99.5, but Supertrend is not allowed to step back; it stays at 101.5. That is what a “trailing stop” means: it ratchets up as the price rises and stays put on pullbacks. Only when the close breaks below 101.5 does it flip to short, switching to the upper band 4.5 above the midline and chasing down from above.
Compared with the SAR: the SAR tightens faster and faster until it sits right next to the price; Supertrend always stays 3 × ATR away. So small pullbacks cannot reach it, but when the trend really turns, the price has to cover that distance first before it flips.
The formula
Midline = (high + low) ÷ 2
Upper band = midline + 3 × ATR(10)
Lower band = midline − 3 × ATR(10)
When long: Supertrend = lower band, and it can only move up, never down
Close breaks below it → flips to short and uses the upper band (which can only move down)
Supertrend is not a built-in MT5 indicator; you need to install a custom indicator, while charting platforms such as TradingView have it built in. Different versions may differ slightly in how they calculate ATR and in their default settings, so check before comparing.
Read the chart: gold in 2024, compared with the SAR, following 1 to 4
The chart below uses the same stretch as the Parabolic SAR article: gold (XAUUSD) on the daily timeframe from November 2023 to June 2024, taken from MT5’s historical prices. To make comparison easy, the SAR is also drawn on the chart as small grey dots.
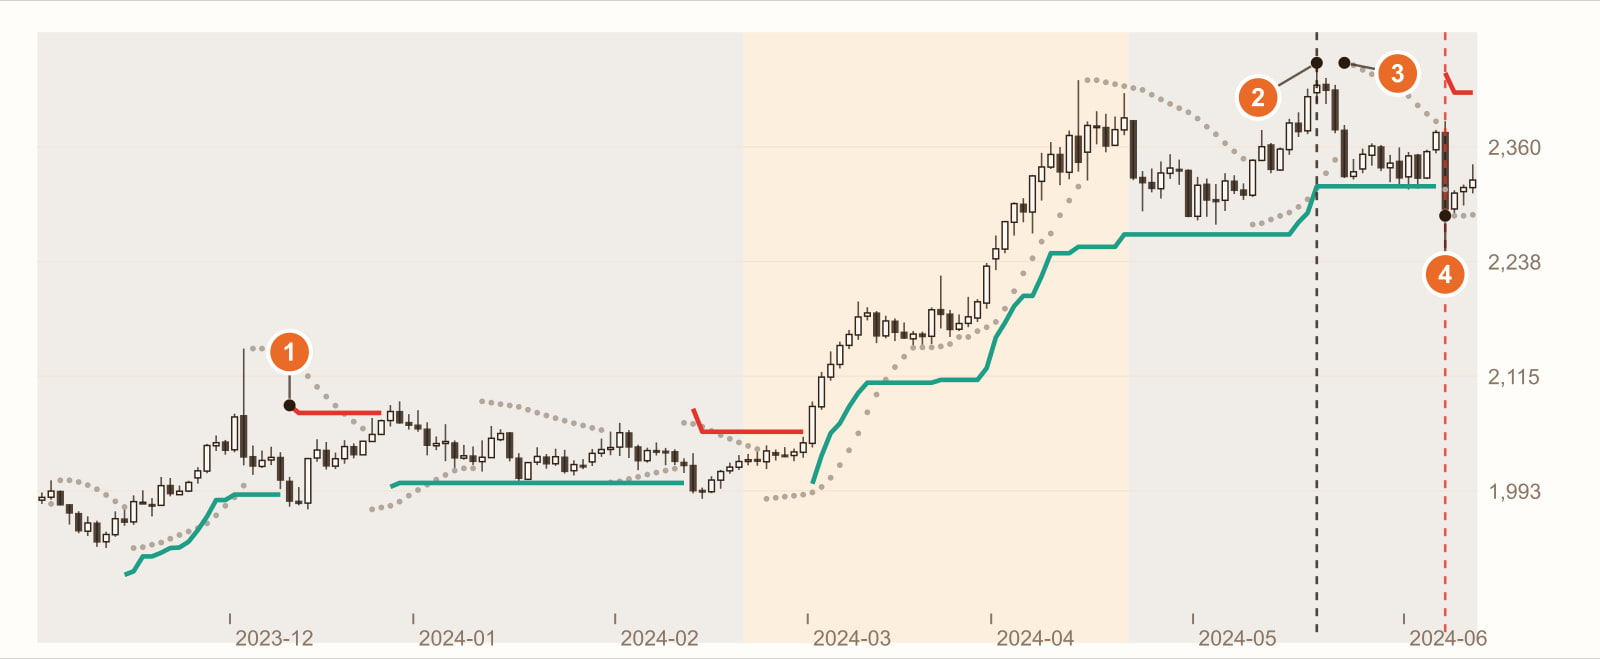
In the range, Supertrend flipped only 3 times. On the same range, the grey SAR flipped 7 times. Across the whole chart, Supertrend flipped 5 times and the SAR 12 times. Each flip means a stop-out plus a reversal, so every flip avoided saves one round trip of spread and small stop loss.
20 May: the highest close, 2,426. From here the top formed and the price fell back.
The SAR flips short: the 3rd bar after the high (23 May). At this point the price was 4.0% off the high. The SAR sits close, so it is touched as soon as the price pulls back.
Supertrend flips short: the 14th bar after the high (7 June). By now the price was already 5.5% off the high. That is 11 bars later than the SAR, giving back an extra 1.5 percentage points.
1 and 4 are two sides of the same distance: in a range, the distance keeps small wobbles from reaching it; when the trend turns, the same distance makes it several bars late to confirm.
This is a real stretch of historical prices, used to show how Supertrend behaves. It is not a general rule. Change the instrument, the timeframe or the period, and every number will change.
What you see, what it means
| What you see | What it usually means | But be careful |
|---|---|---|
| A green line below the price, stepping up | A rally, with the stop ratcheting up | It stays 3 × ATR from the price, so on exit you give back that distance |
| The green line stays put on a pullback | Normal: the stop only moves up, never steps back | If the pullback goes deep enough to touch it, it flips short |
| It flips to a red line | The close broke the stop; now leaning bearish | By then the price is usually some way off the high (4 on the chart) |
| Few flips in a range | The distance is wide enough that small wobbles cannot reach it (1 on the chart) | Fewer, not none |
How to use it: three examples
Example 1: are you more afraid of being shaken out, or of giving back?
If you fear being slapped again and again in a range, Supertrend suits you better than the SAR (1 on the chart); if you fear giving back too much when a trend ends, the SAR or a smaller multiplier suits you better (3 comes before 4 on the chart). It is a trade-off; neither is always better.
Example 2: use it only for exits
As with the SAR, many traders only use Supertrend as a trailing stop and leave entries to other conditions, so they do not flip back and forth with it in a range. For example: “Keep holding while the close is above Supertrend; exit when it closes below.”
Example 3: adjust the multiplier
The larger the multiplier, the wider the distance, the fewer the flips and the later the exit; the smaller, the closer it hugs the price. Using the example above: with a multiplier of 3 the distance is 4.5, with 2 it is 3. The common 10 and 3 are just a starting point; what suits your instrument needs testing.
Common mistakes
1. Thinking it never gets shaken out
Supertrend just gets shaken out less often, not never. In the range on the left of the chart, it still flipped 3 times.
2. Making the multiplier huge to avoid being shaken out at all
The larger the multiplier, the more you give back when the trend turns. Take it far enough and it may only exit long after the trend has reversed.
3. Comparing Supertrend across platforms directly
Supertrend is not a built-in MT5 indicator; each implementation is written differently, and the ATR smoothing may differ too. Before switching platforms, check the settings and values against each other.
FAQ
What is the Supertrend indicator?
Supertrend is a trailing stop line that uses ATR as its distance. When the price is above the line it leans bullish; when the close breaks below, it flips to bearish. The common default is an ATR period of 10 and a multiplier of 3, meaning it stays 3 × ATR from the price’s midline.
Which is better, Supertrend or the Parabolic SAR?
Supertrend flips less often and gets shaken out less in ranges, but exits later when the trend turns; the SAR trails more tightly and exits earlier, but flips more in ranges. Which is better depends on your instrument and which kind of mistake you fear more.
How should Supertrend be set?
The common default is 10 and 3. The larger the multiplier, the less likely it is to flip and the later it exits; the smaller, the closer it hugs the price. It is best to use backtests to compare how several settings perform on your instrument.
Does MT5 have Supertrend?
MT5 has no built-in Supertrend; you need to install a custom indicator.
Conclusion
Supertrend getting shaken out less is real: on the same stretch it flipped 5 times, the SAR 12. Its lateness is real too: after the top, it was 11 bars later than the SAR and gave back an extra 1.5 percentage points. Both come from the same distance.
So the real question is: on your instrument, do the flips you avoid pay for the extra you give back by exiting later? One stretch of historical prices cannot answer that. Backtest it with our AI Strategy Assistant and you will know.
Write the condition as one sentence, for example “hold the long position while the close is above Supertrend, exit when it closes below”, give it to MASQuant’s AI Strategy Assistant, and press go to start the backtest. The backtest environment includes real market frictions such as spreads, slippage, changes in market liquidity and execution delays (see the AI Strategy Assistant guide for how to use it). Then change the multiplier from 3 to 2 and run it again, and you will see the cost of the distance. A backtest tells you “how this rule performed in past market conditions”, not a guarantee about the future.
An idea only becomes a strategy once it’s been tested.
The price chart in this article is taken from historical prices on the MT5 platform (daily; quotes and daily candle cut-off times differ slightly between platforms, so values may not match exactly), and the indicators are calculated by a program using the standard formulas; the round numbers in the example are not market data. Historical prices are used only to show how the indicator behaves and do not represent future price movements.
Risk disclosure: CFDs are high-risk financial products and can lead to rapid loss of capital. Past performance does not guarantee future results. All strategies and backtests are for reference only and do not constitute investment advice. Please read our Risk Disclosure carefully before trading.
Further reading:


