
What Is the Money Flow Index (MFI)? RSI With Volume Added, Where One Volume Spike Lasts Two Weeks
“The price closed higher, so how did MFI drop below 20 and turn oversold?”
Because MFI doesn’t just look at up and down; it also looks at volume. MFI is RSI with volume added: the heavier a day’s volume, the louder it speaks. A single candle with a volume spike can push MFI to an extreme, and it stays in the calculation, only leaving after a full 14 bars. This article first works through 4 candles, then uses a real chart marked 1 to 4 (the S&P 500 index, November 2016) to show what this looks like when it actually happens.
This article is part of MASQuant’s “Trading Academy · Technical Indicators” series. All the indicators are sorted by category in Technical Indicators: The Complete Guide.
In one sentence
MFI = RSI weighted by volume, ranging from 0 to 100.
The question it answers: “Over the recent period, did the up days or the down days carry more volume?”
RSI is like a show of hands: each day gets one vote, one for up or one for down. MFI is like voting by shareholding: a day with heavy volume holds more votes. Usually the two kinds of vote come out about the same; but as soon as one day walks in holding 8 times the usual votes, that one day decides the result.
Work it out once: 3 up, 1 down, yet it leans bearish
MFI first calculates each candle’s “typical price”: (high + low + close) ÷ 3. If the typical price is higher than the previous candle’s, this candle’s “money flow” (typical price × volume) goes on the up side; if it is lower, it goes on the down side. Here are 4 candles (the following are round numbers made up for the example, not market data):
| Candle | Typical price | Vs. previous candle | Volume | Money flow |
|---|---|---|---|---|
| Candle 1 | 101 | Higher | 100 | Up 10,100 |
| Candle 2 | 102 | Higher | 100 | Up 10,200 |
| Candle 3 | 103 | Higher | 100 | Up 10,300 |
| Candle 4 | 102 | Lower | 600 | Down 61,200 |
The up side totals 30,600 and the down side totals 61,200. MFI = 100 − 100 ÷ (1 + 30,600 ÷ 61,200) = 33.3.
With the same 4 candles, if you ignore volume and treat every candle’s move as equally big (the RSI idea), 3 up and 1 down gives 75. The whole difference comes from candle 4: its volume is 6 times normal, so one candle outweighs the three before it.
The formula
The usual setting is 14:
1 Typical price = (high + low + close) ÷ 3
2 Money flow = typical price × volume
3 Over the last 14 bars:
   typical price higher than the previous bar → add its money flow to "up"
   typical price lower than the previous bar → add its money flow to "down"
4 MFI = 100 − 100 ÷ (1 + up total ÷ down total)
MFI was introduced by Gene Quong and Avrum Soudack. The calculation has the same shape as RSI; only the weight of each bar changes to “typical price × volume”. A common reading is that above 80 is running hot and below 20 is running cold; like RSI’s 70 and 30, these are only reference lines.
MT5 has a built-in Money Flow Index with a default of 14, and the volume it uses is tick volume (explained in the next section).
On CFDs, what is MFI’s “volume”?
Stocks and futures have trading volume published by an exchange; CFDs mostly have no central exchange, so what is usually available in MT5 is tick volume: the number of times the price quote changed during the period, not how much money actually changed hands. So on CFDs, the “money” in MFI is really “how busy the quotes were”.
The number of quote changes is often used as a proxy for how active the market is, but it is affected by volatility, the quote source and the trading session. The same instrument may also produce a different MFI on different platforms.
Read the chart: the S&P 500 in November 2016, following 1 to 4
The chart below shows the S&P 500 index (US500) on the daily timeframe from September to December 2016, taken from MT5’s historical prices. Over the whole stretch it went from 2,185.3 to 2,238.8. The candle on 9 November (the day the US presidential election votes were counted) was unusual: it opened at 2,141.43, dropped as low as 2,031.30 during the session, and finally closed at 2,164.09, 1.19% above the previous day’s close. The grey shading marks the 14 bars during which this candle was still inside the MFI calculation.
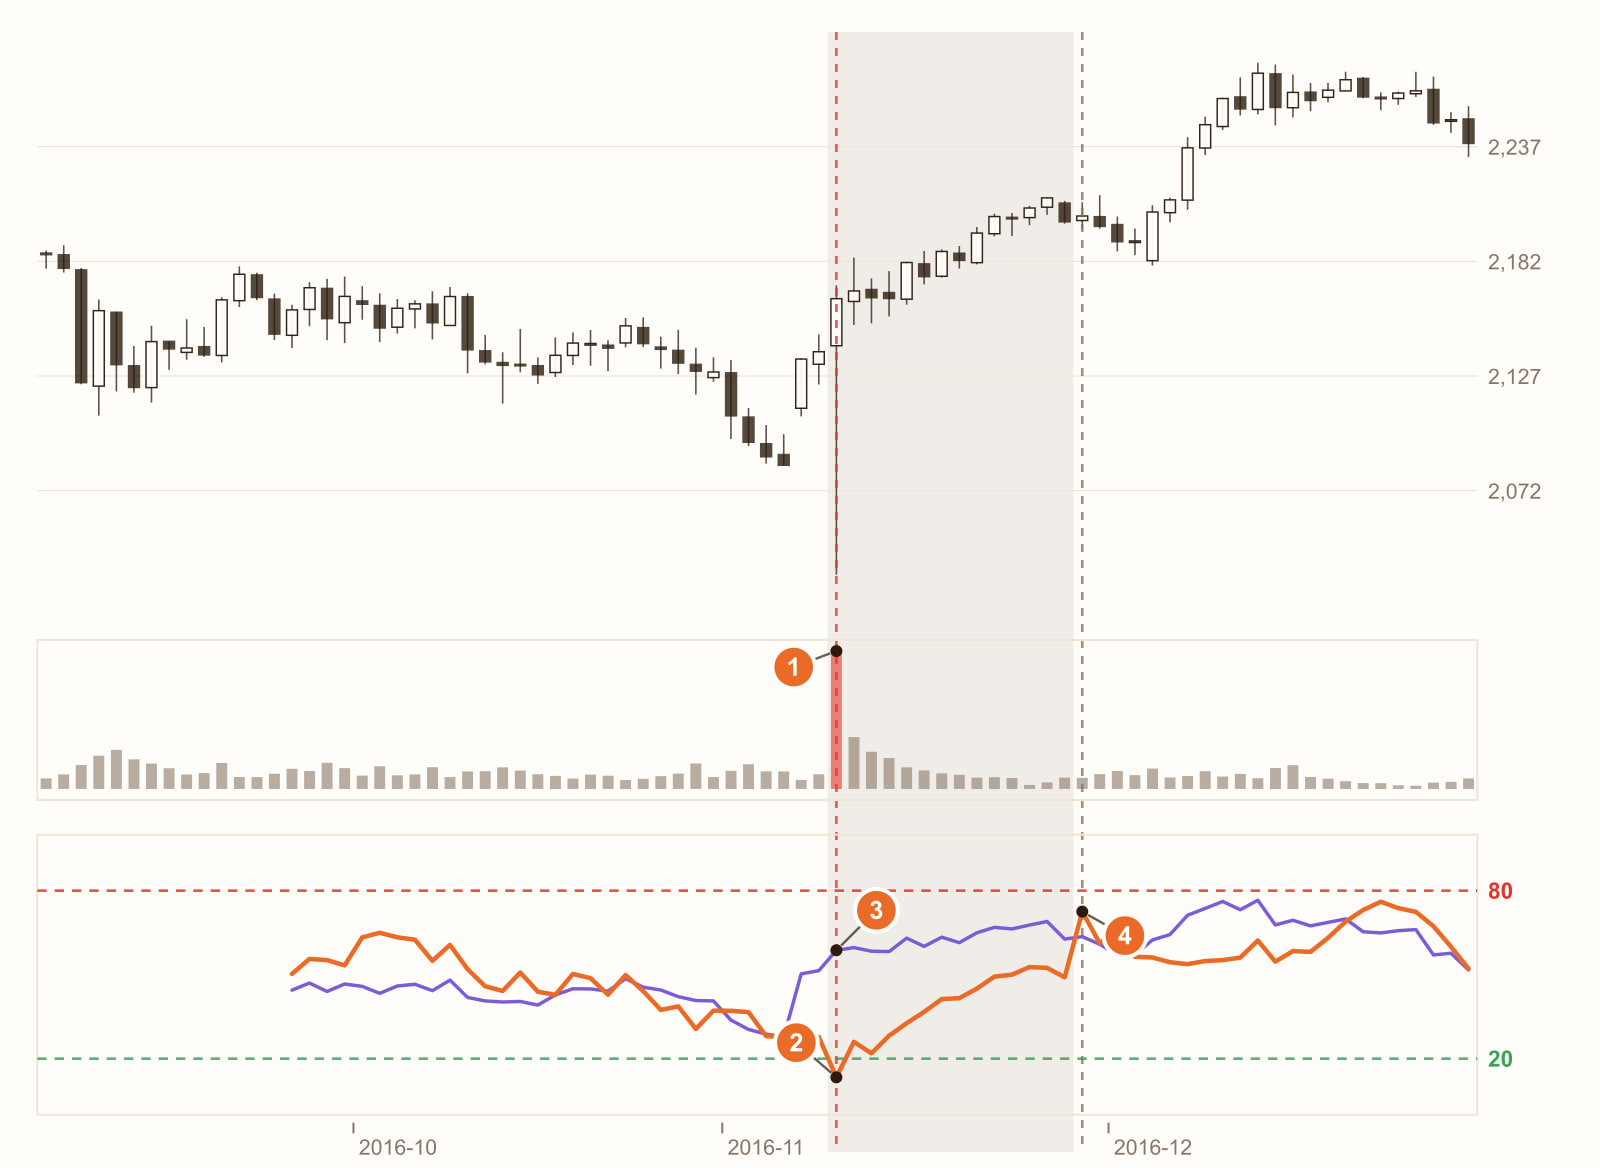
Tick volume was 8.7 times normal (9 November 2016). That day’s tick volume was 69,099, while the median of the previous 45 days was only 7,936.
MFI fell from 27.8 to 13.3, into the oversold zone below 20. The close was clearly higher, so why was it counted as down? Because MFI looks at the typical price: that day’s intraday low of 2,031.30 dragged (high + low + close) ÷ 3 down to 2,121.94, below the previous day’s 2,136.05. All of that 8.7-times volume went to the “down” side.
On the same day, RSI rose from 51.4 to 58.7. RSI only looks at the change in the close, and an up close is an up close. The same candle, yet one indicator says oversold and the other leans bullish, 45 points apart.
14 bars later, MFI jumped from 49.0 to 72.5 in one day (29 November). The price moved only 0.13% that day. The jump happened because the 9 November spike candle left the 14-bar calculation window, and the huge volume weighing on the “down” side was removed all at once. Over those 14 bars, a large part of MFI’s path was decided by that one day.
This is a real stretch of historical prices, used to show how MFI behaves. It is not a general rule. Change the instrument, the timeframe or the period, and every number will change.
What you see, what it means
| What you see | What it usually means | But be careful |
|---|---|---|
| MFI above 80 | The up days have had more volume lately; running hot | In a trend it can stay up there for a long time and stop reacting, just like RSI |
| MFI below 20 | The down days have had more volume lately; running cold | It may be caused by a single volume spike (2 on the chart) |
| MFI and RSI far apart | Volume is concentrated on a few days | Look back for the volume-spike candle (2 3 on the chart) |
| MFI suddenly jumps while the price is flat | A volume-spike candle from 14 bars ago has just left | This is not new money moving in or out (4 on the chart) |
| The price makes a new high, but MFI is lower than last time | Less volume behind the new high | A divergence is a clue, not a verdict |
How to use it: three examples
Example 1: read it alongside RSI to find the days where volume piles up
MFI and RSI use the same calculation; the difference is volume. When the two lines are far apart, a few recent days had especially heavy volume. First find which day it was and what happened, then decide whether to trust MFI’s signal.
Example 2: spotting overheated and oversold levels in a range
In a market with no clear trend, the rule can be written as: “Go long only after MFI falls below 20 and then climbs back above 20; go short only after it rises above 80 and then falls back below 80.” Waiting for it to leave the extreme zone before entering gives fewer false signals than entering the moment it touches.
Example 3: give volume-spike signals a cooling-off period
If an extreme MFI reading was caused by one volume spike, that volume stays in the calculation for 14 bars, and when it finally leaves it makes MFI jump again. You can add a rule: “When any of the last 14 bars has volume more than 5 times the average, ignore MFI signals.”
All three examples need to keep one thing in mind: MFI lets the heavy-volume days speak louder. On CFDs, that “volume” is the number of quote ticks; it reflects how busy the quotes were, not necessarily real money.
Common mistakes
1. Buying as oversold whenever MFI is below 20
At 2 on the chart, the day closed up 1.19%, yet MFI was 13.3. It dropped into the oversold zone because of one 8.7-times volume-spike candle whose typical price happened to be lower than the previous day’s. When you see an extreme reading, look for the cause first.
2. Assuming MFI must be more accurate than RSI
MFI adds volume: more information, but also more noise. On CFDs it uses tick volume, not the actual traded value. Whether it beats RSI can only be known by backtesting it on your instrument.
3. Taking a big jump in MFI as money pouring in
At 4 on the chart, MFI jumped 23.5 in one day while the price moved only 0.13%. That was the volume spike from 14 bars earlier leaving the calculation window, not someone buying heavily today.
FAQ
What is the MFI indicator?
MFI (Money Flow Index) is RSI with volume added: it uses typical price times volume as the weight of each bar, then calculates the ratio between up and down. It ranges from 0 to 100, and the usual period is 14.
How are MFI and RSI different?
RSI only looks at the size of the change in the close; MFI looks at the direction of the typical price and then multiplies by volume. When volume is spread evenly the two are similar; when volume is concentrated on a few days, they can differ a lot.
How do you read MFI 80 and 20?
A common reading is that above 80 is running hot and below 20 is running cold. As with RSI, in a clear trend MFI can stay in the extreme zone for a long time, so it can’t be used on its own as a reversal signal.
Does MT5 have MFI?
Yes. MT5 has a built-in Money Flow Index with a default period of 14, and by default it uses tick volume (Tick Volume) for volume.
Conclusion
The idea behind MFI makes sense: moves backed by volume carry more weight than moves without it. The cost is that one volume spike can dominate it for a full 14 bars, and on CFDs that “volume” is the number of quote ticks.
So the real question is: on your instrument, are MFI’s signals better than RSI’s? Or does it just add noise from volume spikes? One stretch of historical prices cannot answer that; you have to backtest the rule over many stretches of the market.
Don’t have rules of your own yet, and don’t want to piece them together one indicator at a time? With MASQuant’s Strategy Genie, you just choose an investment style first; the AI analyses market conditions, selects instruments and gives you three candidate strategies at once. Each one has already been backtested on historical data, with its returns and maximum drawdown laid out in the open, and then you decide whether to deploy it to MT5.
If you already have an idea of your own, write the condition as one sentence, for example “only go long after MFI falls below 20 and then climbs back above 20”, give it to the AI Strategy Assistant, and press go to start the backtest. The backtest environment includes real market frictions such as spreads, slippage, changes in market liquidity and execution delays (see the AI Strategy Assistant guide for how to use it). Then swap MFI for RSI and run it again, and you will see whether adding volume actually helped. A backtest tells you “how this rule performed in past market conditions”, not a guarantee about the future.
An idea only becomes a strategy once it’s been tested.
The price chart in this article is taken from historical prices on the MT5 platform (daily; quotes and daily candle cut-off times differ slightly between platforms, so values may not match exactly), and the indicators are calculated by a program using the standard formulas; the round numbers in the example are not market data. Historical prices are used only to show how the indicator behaves and do not represent future price movements.
Risk disclosure: CFDs are high-risk financial products and can lead to rapid loss of capital. Past performance does not guarantee future results. All strategies and backtests are for reference only and do not constitute investment advice. Please read our Risk Disclosure carefully before trading.


