
What Is the Donchian Channel? Should You Chase a Break Above the 20-Day High?
“It closed at a new 20-day high. That’s a breakout, so should I chase it?”
The Donchian Channel simply draws that sentence as lines: the upper band is the highest high of the last 20 bars, and the lower band is the lowest low of the last 20 bars. When the price breaks above the upper band, it has made a new 20-bar high. In a trend it can catch the big moves; in a range it produces false breakout after false breakout. This article first works it out once with a table, then puts both situations on the same real chart marked 1 to 4 (the S&P 500 index, 2025–2026).
This article is part of MASQuant’s “Trading Academy · Technical Indicators” series. All the indicators are sorted by category in Technical Indicators: The Complete Guide.
In one sentence
Donchian Channel = the channel formed by the “highest high” and the “lowest low” of the last N bars.
The question it answers: “Has the price moved out of the range of the last N bars?”
The Donchian Channel is like the record line in a high-jump competition: the upper band is the best result of the last 20 events, and the lower band is the worst. Clear the record line today and you have set a new record. But the record only looks back over the last 20 events, so once an old record expires, the line drops. That is why the channel only moves when there is “a new high or a new low” or when “an old record expires”; the rest of the time it is a flat line that moves in steps.
Work it out once: compare a breakout with yesterday’s channel
To keep the numbers simple, use a 5-bar channel (the following are round numbers made up for the example, not market data):
| Bar | High / close | Upper band on this bar (including itself) | Upper band on the previous bar |
|---|---|---|---|
| Bar 5 | 12 / 11.5 | 13 | — |
| Bar 6 | 15 / 13.5 | 15 | 13 |
The highs of the first 5 bars are 10, 12, 11, 13 and 12, so the upper band is 13. Bar 6 shoots up to 15 and closes at 13.5. If you compare it with “today’s upper band”, that band already includes today’s 15, so the close can never be above it. That is why a breakout must always be compared with “yesterday’s upper band”: yesterday’s was 13 and today closed at 13.5, so that is a breakout; had it closed at only 12.5, it would not be one yet. A common illusion on the chart is to treat a channel that today’s own bar has already pushed up as one that has not yet been broken.
The formula
The usual setting is 20:
1 Upper band = highest high of the last 20 bars
2 Lower band = lowest low of the last 20 bars
3 Midline = (upper band + lower band) ÷ 2

Breakout long: today's close > yesterday's upper band
Breakdown exit: today's close < yesterday's 10-bar lowest low (one of the Turtle Trading exits)
The Donchian Channel is named after Richard Donchian, who is regarded as a pioneer of trend following. The famous “Turtle Trading” system of the 1980s used it: enter on a 20-day high, exit on a 10-day low (another version uses 55 and 20 days).
The indicators that come with an MT5 installation include two: Donchian Channel in the Free Indicators folder (default 20), and Price Channel in the Examples folder (default 22). MT5’s Donchian Channel includes the current bar, so when judging a breakout, compare with the previous bar’s upper band.
Read the chart: the S&P 500 in 2025–2026, following 1 to 4
The chart below shows the S&P 500 index (US500) on the daily timeframe from late November 2025 to June 2026, taken from MT5’s historical prices. It went through a range, a rally and a consolidation near the highs in turn: from 28 November 2025 to 27 March 2026 it closed between 6,355 and 6,987, finally slipping to the bottom of the range; from 30 March to 21 May it rose from 6,339 to 7,447, a gain of 17.5%. The solid orange lines are the 20-bar upper and lower bands, the gold dashed line is the midline, and the purple dashed line is the 10-bar lowest low (the exit line).
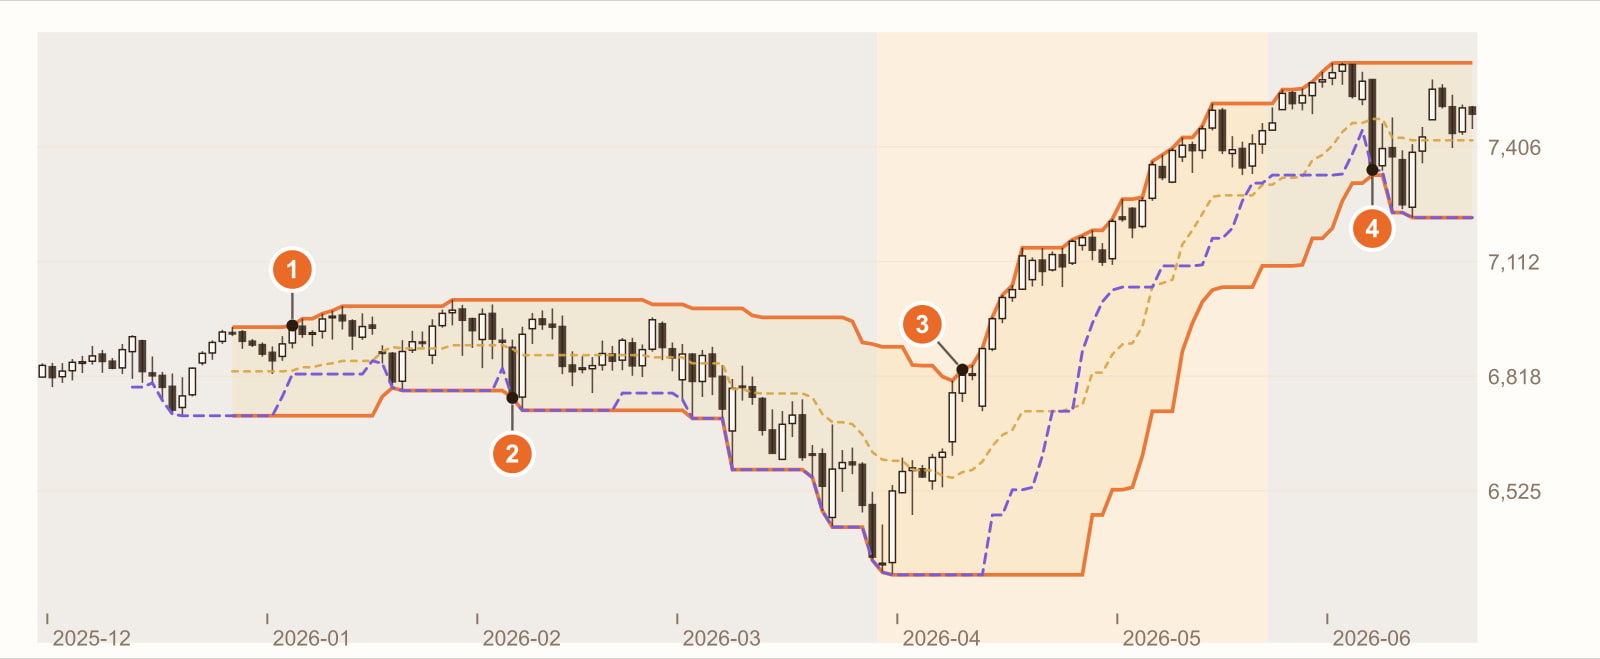
An upside breakout, back below the midline 9 bars later (6 January 2026). The close was above the previous day’s 20-bar highest high, so it looked like a breakout. 9 bars later the close fell back below the midline; had you chased it on the breakout day, you would have been down 1.0% at this point.
A downside breakout, reversed the very next day (5 February 2026). The close fell below the 20-bar lowest low, and the next day it rose back above the midline. Had you gone short, you would have lost 2.3% in a single day. Over the whole range there was 1 breakout up and 3 down, and all 4 fell back to the midline within 10 bars, each losing between 0.7% and 3.6%.
The real breakout: the 8th bar after the rally began (9 April 2026). After this breakout the price kept climbing, and during the rally 14 bars closed at a new 20-bar high. But note: when the breakout signal appeared, the price was already up 7.6% from the start of the rally. The Donchian Channel waits for the price to move out of the range of the last 20 bars first, so it is always a stretch late.
A close below the 10-bar lowest low: exit (5 June 2026). From the entry at 3 to here, the gain was 7.8%; at the highest point in between (2 June) it had been up 11.7%, so by the exit 3.4% had been given back from the high. Entering a stretch late and exiting a stretch late is the fixed cost of a breakout system.
This is a real stretch of historical prices, used to show how the Donchian Channel behaves. It is not a general rule. Change the instrument, the timeframe or the period, and every number will change.
What you see, what it means
| What you see | What it usually means | But be careful |
|---|---|---|
| A close above yesterday’s upper band | A new 20-bar high | In a range it is often a false breakout (1 on the chart) |
| A close below yesterday’s lower band | A new 20-bar low | Same as above (2 on the chart) |
| A narrow channel with flat upper and lower bands | The price is circling within a small range | Which way it will break out is not yet known |
| The upper band keeps stepping up | New highs keep coming; a trend is under way | By the time of the breakout, the move has usually already run a stretch (3 on the chart) |
| The price falls back below the midline | The breakout’s momentum has not carried on | Often taken as confirmation of a false breakout |
How to use it: three examples
Example 1: Turtle-style breakout entries and breakdown exits
The rule can be written as: “Go long when the close breaks above yesterday’s 20-bar highest high; exit when the close breaks below yesterday’s 10-bar lowest low.” This is the classic version. Its results depend heavily on the market: plenty of trends and it does well; plenty of ranges and it keeps getting whipsawed.
Example 2: add a “don’t chase in a range” filter
Breakouts in a range mostly fall back, so you can add a condition that checks whether there is a trend, for example “only accept breakouts when ADX is above 20” (see What is the ADX indicator?). The cost is that some real breakouts will be missed because ADX has not risen yet.
Example 3: use the channel as a trailing stop
Don’t use the channel for entries, only for exits: once you are long, put the stop at “the 10-bar lowest low”, and as the price makes new highs, the stop steps up with it. That is exactly how the exit at 4 on the chart happened.
All three examples have to accept the same thing: the Donchian Channel is always one step behind. It waits for the price to prove it has left the range before it says “breakout”. The cost of that step is false breakouts in a range, and the part of the move you miss in a trend.
Common mistakes
1. Judging a breakout against today’s upper band
The channel includes today, and today’s high pushes the upper band up. The close has to be compared with “yesterday’s upper band”; otherwise it will never break out, or your backtest will use data that could not have been known at the time.
2. Chasing every breakout, whatever the market is doing
In the range on the chart, all 4 breakouts fell back to the midline within 10 bars. In a range, breakouts are the norm and follow-through is the exception.
3. Thinking a breakout system can catch the start of a rally
The breakout at 3 on the chart came on the 8th bar after the rally began, when the price was already up 7.6%. A breakout system catches the middle of a trend, not its start.
FAQ
What is the Donchian Channel?
The Donchian Channel is made up of the highest high of the last N bars (the upper band), the lowest low (the lower band) and the midpoint of the two (the midline). The usual period is 20, and it is most often used to judge breakouts.
How is the Donchian Channel different from Bollinger Bands?
Bollinger Bands use an average plus and minus standard deviation, so they widen and narrow smoothly with volatility; the Donchian Channel looks only at the highest high and the lowest low, moves only on a new high, a new low or when an old high or low expires, and so is drawn in steps.
How does Turtle Trading use the Donchian Channel?
The common account is: enter on a 20-day high and exit on a 10-day low (another version uses 55 and 20 days), combined with position sizes and stops set using ATR.
Does MT5 have the Donchian Channel?
It comes among the indicators installed with MT5: Donchian Channel in the Free Indicators folder (default 20), and Price Channel in the Examples folder (default 22). It is not built directly into the indicator list.
Conclusion
The Donchian Channel’s rule fits in one sentence: buy on a new high, sell on a new low. Its results also fit in one sentence: with a trend it does well; without one, it keeps getting whipsawed.
So the real question is: on your instrument, do the losses from false breakouts and the stretch that real breakouts catch add up to a profit or a loss? One stretch of historical prices cannot answer that; you need to backtest the rule across many stretches of the market.
No rules of your own yet, and don’t want to piece them together one indicator at a time? With MASQuant’s Strategy Genie, you just pick an investment style first: the AI analyses market conditions, selects instruments and gives you three candidate strategies at once. Each one has already been backtested on historical data, with its return and maximum drawdown of capital laid out for you to see, and then you decide whether to deploy it to MT5.
If you already have an idea of your own, write the condition as one sentence, for example “go long when the close breaks above yesterday’s 20-bar highest high; exit when the close breaks below yesterday’s 10-bar lowest low”, give it to the AI Strategy Assistant, and press go to start the backtest. The backtest environment includes real market frictions such as spreads, slippage, changes in market liquidity and execution delays (see the AI Strategy Assistant guide for how to use it). Then add “only accept breakouts when ADX is above 20” and run it again, and you will see whether the filter is blocking false breakouts or good moves. A backtest tells you “how this rule performed in past market conditions”, not a guarantee about the future.
An idea only becomes a strategy once it’s been tested.
The price chart in this article is taken from historical prices on the MT5 platform (daily; quotes and daily candle cut-off times differ slightly between platforms, so values may not match exactly), and the indicators are calculated by a program using the standard formulas; the round numbers in the example are not market data. Historical prices are used only to show how the indicator behaves and do not represent future price movements.
Risk disclosure: CFDs are high-risk financial products and can lead to rapid loss of capital. Past performance does not guarantee future results. All strategies and backtests are for reference only and do not constitute investment advice. Please read our Risk Disclosure carefully before trading.
Further reading:


