
What Is Stochastic RSI? More Sensitive, and Wrong More Often
“The RSI is too slow. Stochastic RSI is quicker.”
Stochastic RSI really is much faster than the RSI. Its trick is clever: it does not look at price; it looks at whether the RSI itself is high or low compared with its own recent past. Let the RSI tick up a little and it can shoot to the top. But the price of speed is noise. This article first works it out once with 4 RSI values, then uses a real chart marked 1 to 4 (Germany 40 index, 2024) to see what that sensitivity turns into in a range and in a trend.
This article is part of MASQuant’s “Trading Academy · Technical Indicators” series. All the indicators are sorted by category in Technical Indicators: The Complete Guide.
In one sentence
Stochastic RSI = where today’s RSI ranks between the highest and lowest RSI of its own last 14 bars.
The question it answers: “Compared with the recent past, is the RSI high or low right now?”
Think of the difference between “your score” and “your rank”. The RSI is the score you got on this test; Stochastic RSI is where that score ranks among your own last 14 tests. If you have scored between 45 and 55 on your last 14 tests and you get 53 this time, the score is ordinary, but among your recent results it is near the top, so Stochastic RSI will be high.
Work it out once: 4 RSI values are enough
Suppose that over the last 14 bars, the lowest RSI was 45 and the highest was 55 (these are round numbers for the example, not market data). The calculation is: (current RSI − lowest) ÷ (highest − lowest) × 100.
| Current RSI | Calculation | Stochastic RSI | In plain words |
|---|---|---|---|
| 55 | (55 − 45) ÷ 10 × 100 | 100 | The highest RSI of the last 14 bars |
| 53 | (53 − 45) ÷ 10 × 100 | 80 | The RSI is only 53, far from 70, yet Stochastic RSI has already hit the “overbought line” |
| 50 | (50 − 45) ÷ 10 × 100 | 50 | Right in the middle |
| 47 | (47 − 45) ÷ 10 × 100 | 20 | An RSI of 47 is ordinary, yet Stochastic RSI is at the “oversold line” |
This is why it is so sensitive: it compares the RSI with its own recent behaviour, not with 70 and 30. When the RSI wobbles slightly between 45 and 55, Stochastic RSI swings widely between 0 and 100.
In practice, this raw value is averaged over 3 periods to give %K, and %K is averaged over 3 more periods to give %D. The averaged lines are smoother, but the principle is the same.
The formula
1 First calculate RSI(14)
2 Stochastic RSI = (RSI − lowest RSI of the last 14 bars) ÷ (highest − lowest RSI of the last 14 bars)
3 Multiply by 100, take a 3-period average as %K, then a 3-period average of %K as %D
Stochastic RSI was introduced by Tushar Chande and Stanley Kroll in 1994. It applies the stochastic oscillator (the original KD formula) to the RSI. Common settings are written as 14, 14, 3, 3: RSI period 14, stochastic period 14, %K smoothing 3, %D smoothing 3. Above 80 is usually called overbought, below 20 oversold.
Stochastic RSI is not a built-in MT5 indicator; you need to install a custom indicator, while charting platforms such as TradingView have it built in.
Read the chart: Germany 40 in 2024, following 1 to 4
The chart below shows the Germany 40 index (GER40) on the daily timeframe from April 2024 to January 2025, taken from MT5’s historical prices. For the first five months it closed back and forth between 17,308 and 18,947; from September it climbed, closing at 21,018 on 20 January 2025. The middle panel is RSI(14), and the bottom panel is Stochastic RSI.
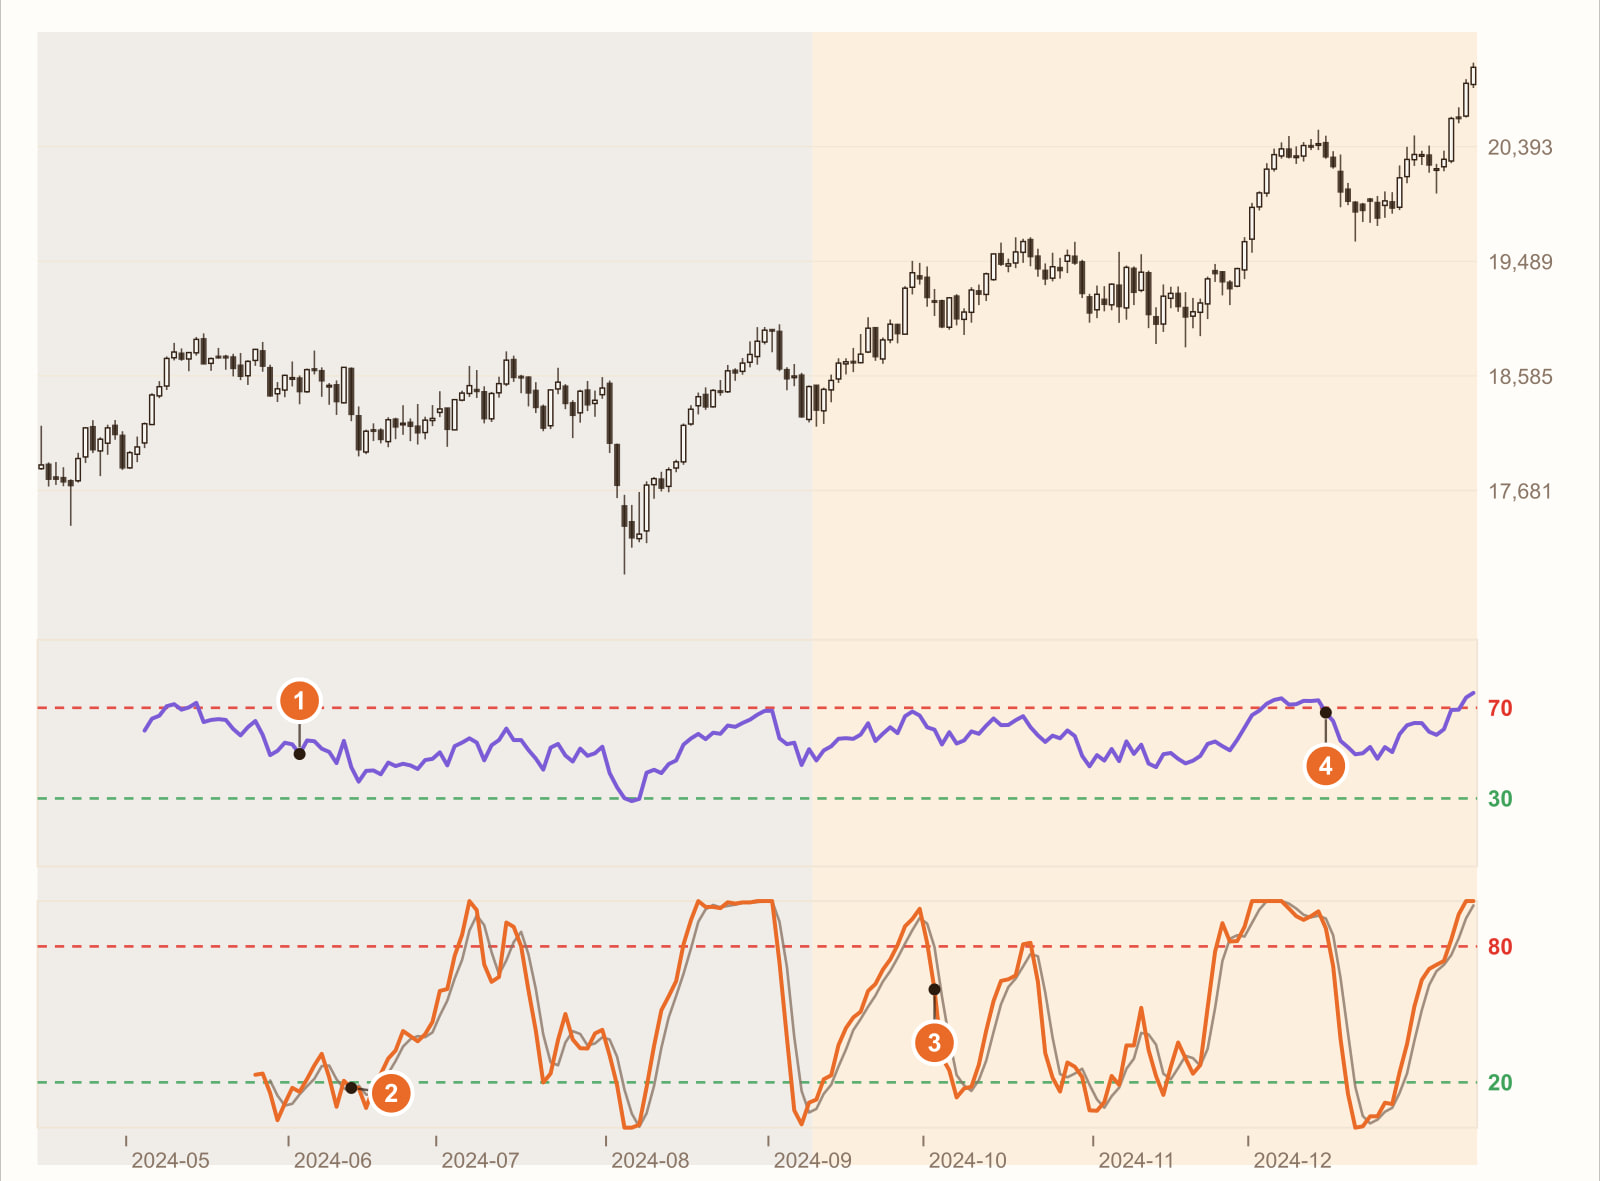
The RSI in the range: quiet (4 June, RSI 49.6). Through the whole range, the RSI never touched 70 and fell below 30 only once; 82% of the time it was between 40 and 60.
Same stretch: Stochastic RSI falls below 20 (13 June). While the RSI was just wobbling between 40 and 60, Stochastic RSI was running end to end: it went above 80 3 times and below 20 6 times. If what you want is short-term turns within a range, it gives you far more of them.
In the rally, Stochastic RSI falls back from above 80 (2 October). In the rally, the price rose 14.8%, and the biggest pullback along the way was only 3.3%. Yet in this stretch, Stochastic RSI fell back from above 80 to below 80 3 times; 3 is the first. With a “sell when it falls back below the overbought line” rule, Stochastic RSI would have had you sell 3 times.
Same stretch: the RSI fell back from above 70 only once (16 December). The RSI is smoothed and measures longer-term momentum, so small pullbacks do not shake it as easily. Stochastic RSI gave 3 times as many sell signals as the RSI, while the price rose throughout.
This is a real stretch of historical prices, used to show how Stochastic RSI behaves. It is not a general rule. Change the instrument, the timeframe or the period, and every number will change.
What you see, what it means
| What you see | What it usually means | But be careful |
|---|---|---|
| Stochastic RSI above 80 | The RSI is high within its own recent range | The RSI itself may be only in the 50s; the price has not necessarily risen much |
| Stochastic RSI below 20 | The RSI is low within its own recent range | Likewise, it does not mean the price has fallen much |
| Wide swings between 0 and 100 in a range | Small turns within the range (2 on the chart) | This is when it is most useful, but each turn is small |
| Falling back from above 80 in a rally | The RSI cooling slightly | Often just a breather (3 on the chart) |
| %K crossing above %D | Short-term strengthening | A little slower than %K alone, with a few fewer false signals |
How to use it: three examples
Example 1: let something else set the direction; it only handles timing
Stochastic RSI looks at small recent ups and downs in the RSI, which suits short-term trading. Leave the big direction to moving averages, the ADX or the RSI itself, and use Stochastic RSI only to find timing within that direction. For example: “Enter when the price is above the 50-day line and Stochastic RSI turns up from below 20.”
Example 2: use 80 and 20 only in ranges
In a range, 80 and 20 are often the end of a small swing (2 on the chart); in a trend, it keeps falling back and shooting up again near the top, calling out a string of sell signals that do not hold (3 on the chart). Judge the market first, then decide whether to listen to it.
Example 3: watch the %K/%D cross, or wait for it to leave the extremes
%K is faster, %D slower. Waiting for %K and %D to cross, or for it to leave the overbought or oversold zone before acting, is a little later but gives fewer false signals.
Common mistakes
1. Thinking it is more “accurate” than the RSI
Stochastic RSI is only more sensitive, not more accurate. It tells you “it’s been running high lately” earlier and more often, and many of those alerts lead nowhere.
2. Using it to trade against a trend
In the rally on the chart, it fell back from overbought 3 times, and the price kept going up. Using it to pick tops in a trend easily has you selling halfway up, again and again.
3. Comparing its 80 with the RSI’s 70
The two measure different things. Stochastic RSI at 80 only means the RSI is high within its recent range; as in the example, the RSI itself may be only 53.
FAQ
What is Stochastic RSI?
Stochastic RSI was introduced by Tushar Chande and Stanley Kroll in 1994. It applies the stochastic oscillator formula to the RSI and measures where the RSI sits within its high–low range over the last N bars, with values from 0 to 100. For example, if over the last 14 bars the lowest RSI was 45 and the highest 55, and the RSI is now 53, Stochastic RSI is 80.
How is Stochastic RSI different from the RSI?
The RSI compares the strength of price gains and losses and is read against 70 and 30; Stochastic RSI compares the RSI with its own recent highs and lows, so it is much more sensitive and touches the extremes far more often. More on the RSI’s strengths and limits: How to Read the RSI Indicator?
What settings should Stochastic RSI use?
The common one is 14, 14, 3, 3. Shorter periods are more sensitive and noisier; longer ones smoother. It is best to compare them with backtests on your own instrument.
How is Stochastic RSI related to KD?
KD (the stochastic oscillator) looks at where the close sits within its recent high–low range; Stochastic RSI uses the same formula, just with the RSI in place of the close. For KD’s trade-offs, see Should you enter on a KD golden cross?
Conclusion
Stochastic RSI’s sensitivity is real: in the same range, while the RSI barely moved, it had touched the extremes 9 times. Its noise is real too: in the rally, it fell back from overbought 3 times as often as the RSI. Both come from the same design: comparing the RSI with its own recent behaviour.
So the real question is: on your instrument, do the short-term opportunities this sensitivity brings pay for the extra false signals? One stretch of historical prices cannot answer that. Backtest it with our AI Strategy Assistant and you will know.
Write the condition as one sentence, for example “enter when the price is above the 50-day line and Stochastic RSI turns up from below 20”, give it to MASQuant’s AI Strategy Assistant, and press go to start the backtest. The backtest environment includes real market frictions such as spreads, slippage, changes in market liquidity and execution delays (see the AI Strategy Assistant guide for how to use it). A backtest tells you “how this rule performed in past market conditions”, not a guarantee about the future.
An idea only becomes a strategy once it’s been tested.
The price chart in this article is taken from historical prices on the MT5 platform (daily; quotes and daily candle cut-off times differ slightly between platforms, so values may not match exactly), and the indicators are calculated by a program using the standard formulas; the round numbers in the example are not market data. Historical prices are used only to show how the indicator behaves and do not represent future price movements.
Risk disclosure: CFDs are high-risk financial products and can lead to rapid loss of capital. Past performance does not guarantee future results. All strategies and backtests are for reference only and do not constitute investment advice. Please read our Risk Disclosure carefully before trading.


