
Should You Buy on a KD Golden Cross? The KD Indicator Is Faster Than Moving Averages — and Fools You More Often
“KD just made a golden cross — should I buy?”
Almost every charting package includes the KD indicator, and the golden cross is its most discussed use. Half of its reputation is deserved: KD is more sensitive than moving averages, and when a move is just starting, it often gives a signal earlier than moving averages do.
The other half gets mentioned less: the same sensitivity turns into noise in a sideways market.
This is part two of MASQuant’s “Trading Academy · The Truth About Indicators” series. Rather than a full introduction to KD, this part covers one thing: where KD’s speed comes from, what it costs, and how to find out whether that trade-off is worth it on your instrument.
The short answer
When a move is just starting, KD beats moving averages; in a sideways market, it crosses the most and fools you most often.
Speed and accuracy are always in a tug-of-war.
What does the KD indicator calculate?
The KD indicator, also known as the Stochastic Oscillator, is generally credited to George Lane. It measures just one thing:
Where the close sits within the recent high–low range.
A close near the top of the range gives a value near 100; a close near the bottom gives a value near 0. The common setting in Taiwanese charting software is (9,3,3): 9 means the last 9 candles, and the two 3s set how much smoothing is applied.
The KD formula: RSV → K → D
Step one is RSV (raw stochastic value), the “position” of this candle’s close:
RSV = (close − lowest low of the last 9) ÷ (highest high of the last 9 − lowest low of the last 9) × 100“The last 9” includes the current candle; the highest and lowest prices are the candles’ highs and lows, not their closes.
Steps two and three smooth RSV twice:
K = previous K × 2/3 + this candle's RSV × 1/3
D = previous D × 2/3 + this candle's K × 1/3
On a daily chart, “previous” means the previous day; when there are no earlier K and D values yet, a common approach is to start with 50.
K takes RSV directly, so it moves fast; D smooths K once more, so it moves slowly. That’s where “K is fast, D is slow” comes from.
A simple example (round numbers for illustration, not market data): the last 9 candles have a high of 110 and a low of 100, this candle closes at 108, and the previous K and D are both 50:
RSV = (108 − 100) ÷ (110 − 100) × 100 = 80
K = 50 × 2/3 + 80 × 1/3 = 60
D = 50 × 2/3 + 60 × 1/3 ≈ 53.3
With the close near the top of the range, RSV is high; K moves up first and D slowly follows.
Golden cross and death cross
- Golden cross: K crosses above D.
- Death cross: K crosses below D.
A reminder: KD calculations differ between charting packages. The “2/3 + 1/3” recursive smoothing above is the common method in Taiwan; the built-in Stochastic in MT5 and TradingView uses different default settings and smoothing. The same chart and the same candle can give different values on a different platform. When switching platforms, check the settings and method first, then compare values.
The upside: when a move is just starting, KD is earlier than moving averages
First, look at the illustration below (a program-generated simulated market, not a real instrument).
Price has been falling, and the decline has only just slowed when KD already makes a golden cross. In the same stretch, the moving-average (MA5 and MA20) golden cross takes another 12 candles to appear in the illustration — by which time price is already well off the low.
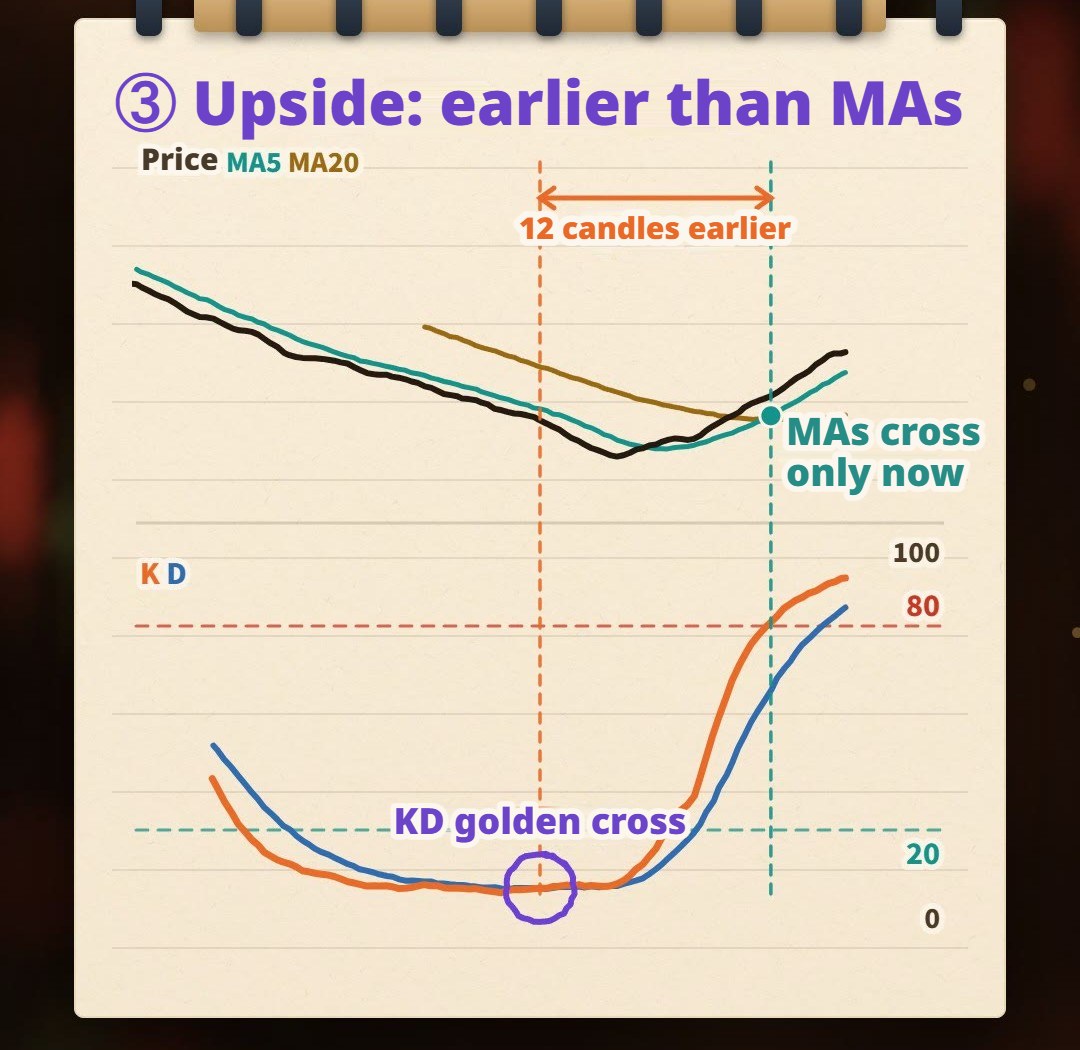
Why is KD earlier? The calculation explains it:
- KD only asks about position. As soon as the close stops hugging the low of the last 9 candles and starts moving toward the middle of the range, RSV jumps, and K quickly crosses D, which is still slowly following behind.
- Moving averages have to wait for the average to catch up. MA20 still contains the higher prices from the earlier decline, so for MA5 to rise above it, several higher closes have to accumulate first.
Sensitivity means being one step ahead of everyone else.
But note the words “the decline has only just slowed”: KD’s golden cross appears when the decline slows down, not when it has ended. Early doesn’t mean right.
The cost: in a sideways market, KD crosses the most
After price rises, it enters a sideways stretch: up and down, no direction.
Here KD makes another golden cross. If it were you, would you buy?
Zoom in on this stretch. In the illustration, KD crosses 6 times during this sideways period — 3 golden crosses and 3 death crosses, telling you to buy one moment and sell the next, while price keeps circling within the same range. In the same stretch, MA5 and MA20 cross only 2 times.
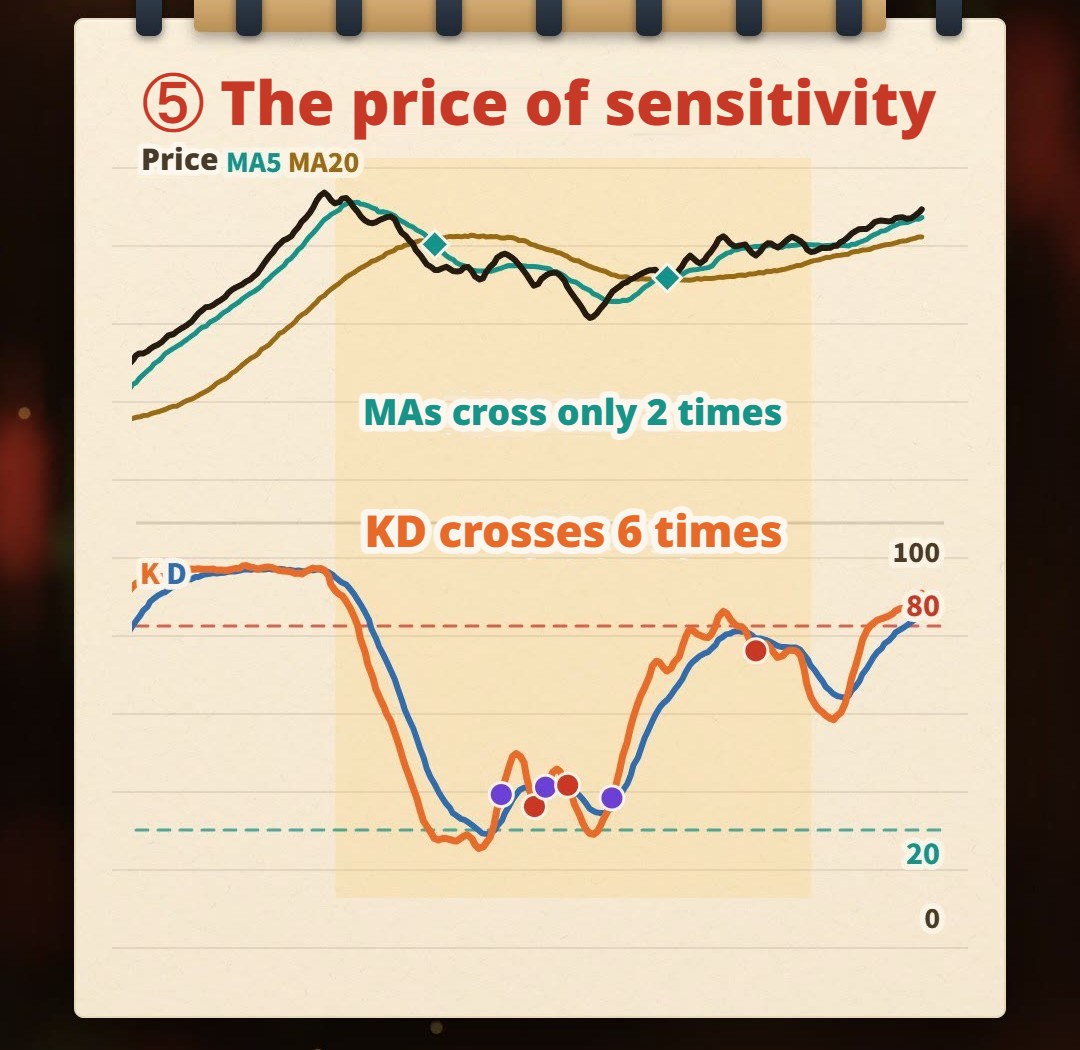
The reason is again in the calculation: RSV always stretches the last 9 candles’ high–low range to 0–100, whether the range is wide or narrow. In a sideways market price moves back and forth within the range, the close is near the top one moment and the bottom the next, RSV swings widely, and K and D naturally keep crossing. Moving averages are averages of price, so most of that back-and-forth is averaged away.
The cost of sensitivity is taking in all the noise too.
Speed and accuracy: always a tug-of-war
Put the two stretches side by side (all results below are from the illustration):
| KD (9,3,3) | Moving averages (MA5 × MA20) | |
|---|---|---|
| When a move is just starting | Golden cross first | Cross comes 12 candles later |
| Crosses during one sideways stretch | 6 times | 2 times |
| Character | Fast, noisy | Slow, less noisy |
These numbers come from this simulated market and illustrate the character of the two indicators; they’re not a general rule. Change the instrument, timeframe or settings and the numbers change — how many candles and how many crosses on your instrument is something you have to test yourself.
Which is better? Neither. The sensitivity that lets you see a move starting one step earlier is the same sensitivity that whips you back and forth in a sideways market — two sides of the same thing, and you can’t take just one. Conversely, fewer moving-average crosses doesn’t mean more accurate; they’re just slower, at the cost of arriving late when a move starts.
Tweaking the settings doesn’t get you out of this tug-of-war either:
- Make 9 smaller, and KD gets more sensitive, with more crosses;
- Make 9 larger, or add more smoothing, and you get fewer crosses, but slower ones.
There’s no standard answer for settings; the same set can behave completely differently on different instruments and timeframes. For how settings affect strategies, see Why Do Most Trading Strategies Fail?.
How to read a KD golden cross: ask three questions first
KD itself won’t tell you whether a move is starting or the market is going sideways. So instead of asking “should I buy on a golden cross?”, think these three questions through before you see a cross.
1. Is the market trending or moving sideways?
This is the most important question, because the same cross means very different things in these two conditions. Common ways to judge are price structure — are the lows rising, are the highs falling, or is price moving back and forth within a range — or whether a longer moving average has a clear direction.
A golden cross in a sideways market is just like one of the 6 crosses above.
2. Where does the cross happen?
Many tutorials pair it with 80/20: KD above 80 is overbought and below 20 is oversold, and only golden crosses at low levels and death crosses at high levels count. This gives fewer crosses, but may miss some moves — another trade-off between speed and accuracy.
3. Do you want early, or do you want confirmation?
A cross you see intraday may disappear once the candle closes: KD uses this candle’s close, and until the candle closes the latest price keeps changing, and so do K and D. So some people wait for the candle to close to confirm; others add a moving-average direction filter and only take crosses in the direction of the bigger trend.
Every extra step of waiting and every extra condition means fewer, later signals. There’s no right or wrong, only trade-offs; what matters is deciding in advance, not after you see a cross.
Also, since crosses can fool you, any rule that uses KD needs one more thing: where to exit when you’re wrong. That’s the stop loss’s job — see How to Set a Stop Loss?.
Common mistakes
1. Buying on every golden cross
Treating every cross as a signal regardless of market conditions. In the illustration’s sideways stretch, that means 6 crosses, buying and selling back and forth, while price never leaves its range.
2. Shortening the settings because KD feels too slow
Wanting it earlier, you make 9 smaller — and it becomes more sensitive and noisier. Finding it too noisy, you lengthen the settings again — and it becomes slow again. Tweaking back and forth is just switching sides on the same rope; the tug-of-war doesn’t go away. And tuning repeatedly on the same stretch of market until it looks best easily produces settings that only fit the past.
3. Treating 80/20 as a reversal signal
“KD has hit 80, time to sell.” In a strong trend, KD can stay above 80 for a long time (often called “KD saturation” or “sticking at high levels”), and being overbought then doesn’t mean you should sell. 80/20 describes position, not direction.
FAQ
What is the KD indicator, and how is it calculated?
The KD indicator (Stochastic Oscillator) measures where the close sits within the recent high–low range, with values from 0 to 100. The common setting in Taiwan is (9,3,3): first calculate RSV = (close − lowest low of the last 9) ÷ (highest high of the last 9 − lowest low of the last 9) × 100, then K = previous K × 2/3 + RSV × 1/3, and D = previous D × 2/3 + K × 1/3.
Can I buy directly on a KD golden cross?
A golden cross means K crosses above D, showing that the close’s position within the recent range is moving up — not that price will definitely rise. It often appears earlier than a moving-average cross when a move is just starting, but it also appears repeatedly in sideways markets, fooling you back and forth. Whether it works depends on whether your instrument spends more time ranging or trending, which only a backtest can tell you.
Which is better, KD or moving averages?
Neither is better. KD is sensitive and often earlier than moving averages when a move starts, but crosses a lot and is noisy in sideways markets; moving averages cross less but are slower. Speed and accuracy are two sides of the same thing, and the right choice depends on your instrument and trading style.
Do I have to use (9,3,3) for KD?
No. (9,3,3) is a common setting in Taiwan, not a standard answer. A shorter period makes KD more sensitive with more crosses; a longer period or more smoothing gives fewer crosses but slower ones. Which settings suit you depends on your instrument, timeframe and trading style, and you need to test them yourself.
Why are my KD values different from someone else’s?
KD calculations and default settings differ between charting packages. The common setup in Taiwan is (9,3,3) with “2/3 + 1/3” recursive smoothing, while the built-in Stochastic in MT5 and TradingView uses different defaults and smoothing; the starting values also affect the early part of the series. Before comparing, check that the settings and method are the same.
Final thoughts
KD’s speed is real: when a move is just starting, it’s often one step ahead of moving averages. KD’s noise is real too: in a sideways market it crosses the most and fools you most often. Both come from the same calculation, and you can’t have just one half.
So the real question isn’t “is KD accurate?” but: does the instrument you trade spend more time ranging or trending? Does KD suit it? One illustration can’t answer that — backtest it with our AI Strategy Assistant and find out.
Write the conditions in one sentence, such as “buy on a KD golden cross, exit on a death cross”, drop it into MASQuant’s AI Strategy Assistant, and the backtest starts with a click. The backtest environment includes real-world market frictions such as spreads, slippage, changing liquidity and execution delays (for how to use it, see the Strategy Assistant User Guide). A backtest tells you “how this rule performed in past markets”, not a guarantee of the future.
An idea only becomes a strategy once it’s been tested.
The charts and numbers in this article come from a program-generated simulated market and don’t represent the actual price action of any instrument.
Risk disclosure: CFDs are high-risk financial products and can lead to rapid loss of capital. Past performance does not guarantee future results. All strategies and backtests are for reference only and do not constitute investment advice. Please read our Risk Disclosure carefully before trading.
Further reading:


