
What Is VWAP? Why the Volume-Weighted Average Price Gets Harder to Move as the Day Goes On
“The price is above VWAP, so today leans bullish.”
VWAP (volume-weighted average price) is often used by short-term traders as “today’s dividing line between bulls and bears”. Its meaning is intuitive: from today’s open until now, roughly what price has the average trade been done at? But VWAP has a trait few people notice: the opening candles have the final say, and the later it gets, the harder it is to move. This article first works it out once with 3 candles, then uses a real chart marked 1 to 4 (EUR/USD, January 2025) to make this clear.
This article is part of MASQuant’s “Trading Academy · Technical Indicators” series. All the indicators are sorted by category in Technical Indicators: The Complete Guide.
In one sentence
VWAP = the “average cost” of all trading from today’s open until now; the more trading at a price, the more it counts.
The question it answers: “So far today, at what price has trading taken place on average? Is the current price above or below that cost?”
Think of a night-market stall’s average stock cost for the day. In the morning it buys 500 kg in one go at 100 per kg, so the average cost settles near 100; even if it tops up another 50 kg at 110 per kg in the evening, the average cost only moves a little. The big purchase sets the tone; a small one barely moves it, however expensive.
Work it out once: 3 candles are enough
To keep the arithmetic simple, each candle below is represented by a single price (these are numbers made up for the example, not market data):
| Candle | Price | Volume | Cumulative (price × volume) | Cumulative volume | VWAP = previous two columns divided |
|---|---|---|---|---|---|
| Candle 1 | 100 | 500 | 50,000 | 500 | 100 |
| Candle 2 | 102 | 300 | 80,600 | 800 | 100.75 |
| Candle 3 | 110 | 50 | 86,100 | 850 | 101.29 |
- Candle 2: volume 300, over a third of the cumulative volume, pulls VWAP from 100 up to 100.75.
- Candle 3: the price shoots straight to 110, but the volume is only 50, so VWAP only moves from 100.75 to 101.29.
These are VWAP’s two traits: prices with heavy volume carry more weight; and because it accumulates from the open onwards, the later a candle is added, the smaller its share.
The formula
Typical price = (high + low + close) ÷ 3
VWAP = Σ(typical price × volume) ÷ Σ volume
(Σ accumulates from the first candle of this session until now, and restarts with each new session)
It differs from an ordinary moving average in two main ways: an ordinary moving average looks at “the last N candles” with each one weighted equally; VWAP looks at “everything from the open until now”, weighted by volume, and resets for each session (usually each day).
Read the chart: three trading days in the euro, following 1 to 4
The chart below shows EUR/USD (EURUSD) on the 1-hour timeframe for three trading days, 24, 27 and 28 January 2025, taken from MT5’s historical prices (times are platform server time, 24 candles per day). The first day rose 0.7%, the second day swung back and forth and closed only 0.2% apart, and the third day fell 0.6%.
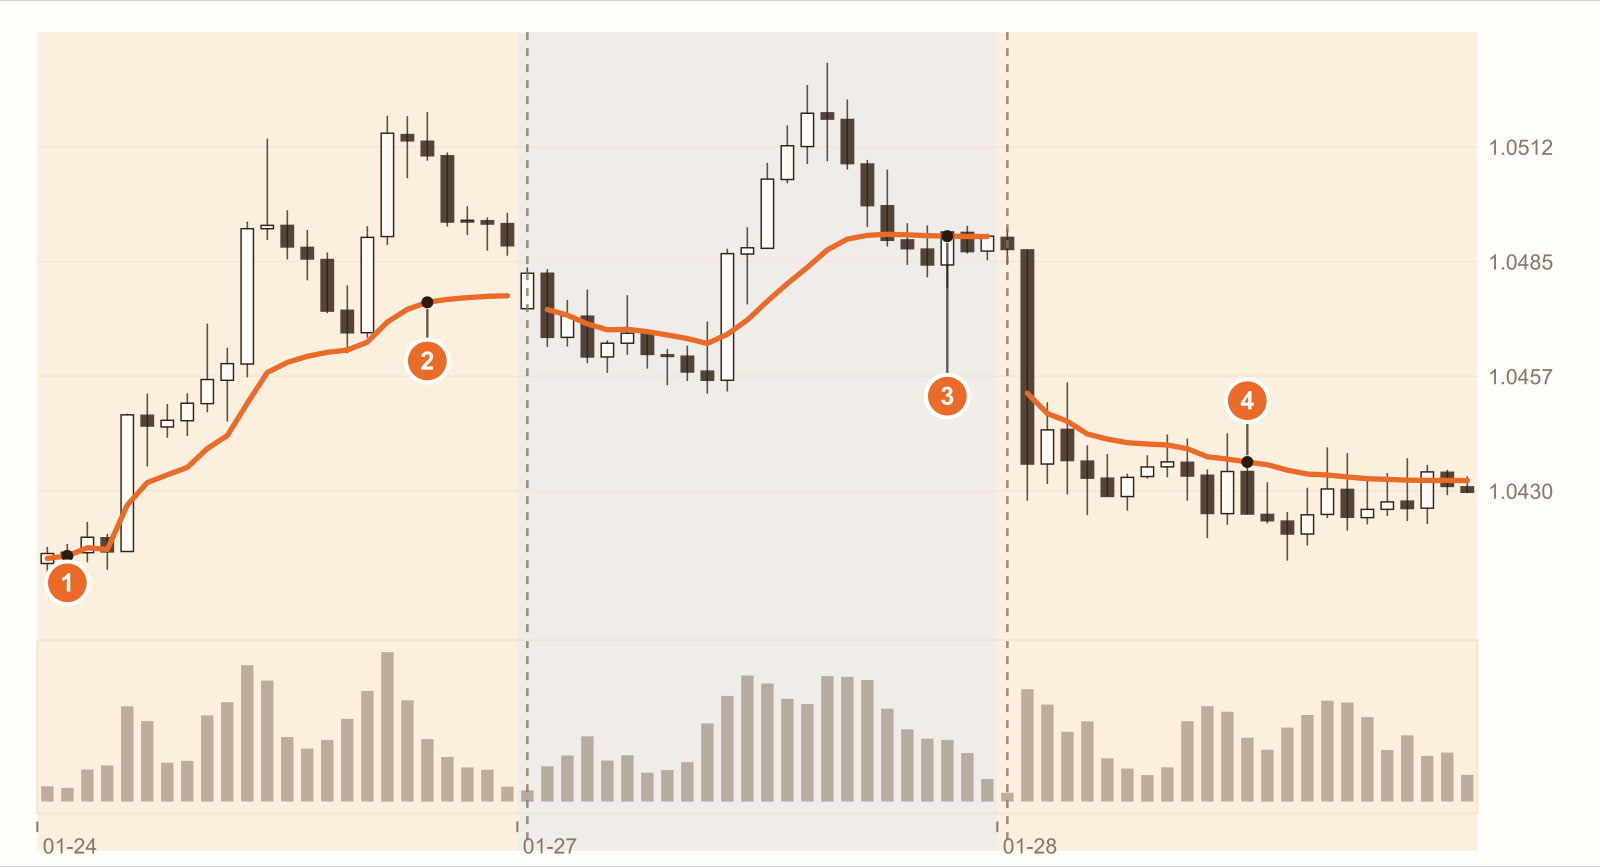
Candle 2 of the first day: a single candle makes up 47% of the cumulative volume. At the start the cumulative volume is still small, so a new candle can pull VWAP a long way.
Candle 20 of the first day: only 4.2% of the cumulative volume. The price is already well above the morning’s level, yet VWAP only creeps up slowly, drifting further and further from the price; by the last candle, the share is just 0.9%. On this day, 23 of the 24 candles closed above VWAP.
The second day: the price crosses VWAP 6 times. Up then down, back and forth: 11 of the 24 candles closed above VWAP, and VWAP gives no direction.
The third day: VWAP stays above the price throughout. It gapped down at the open, and only 1 of the day’s 24 candles closed above VWAP.
234 show what VWAP is good for: which side of it the price spends most of its time on roughly describes who was stronger that day. 12 show its limits: early on, VWAP moves a lot with the price; later in the day, however much the price rises or falls, VWAP only moves slowly.
This is a real stretch of historical prices, used to show how VWAP behaves. It is not a general rule. Change the instrument, the timeframe or the period, and every number will change.
What to watch out for when using VWAP on MT5 and CFDs
- MT5 has no built-in VWAP; you need to install a custom indicator, while charting platforms such as TradingView have it built in. VWAPs written by different people may differ in how the session starts and which price they use (typical price or close).
- CFDs mostly have only tick volume: the number of times the quote changed during the period, not how many contracts actually traded. A VWAP calculated from tick volume is an approximation of volume weighting.
- Where “the day” starts depends on the platform: many CFD instruments trade almost 24 hours a day, and MT5’s daily boundary usually follows the broker’s server time. A different session start gives a different VWAP.
What you see, what it means
| What you see | What it usually means | But be careful |
|---|---|---|
| The price stays mostly above VWAP all day | Today leans strong; the current price is above today’s average cost | It describes today, not tomorrow (2 on the chart) |
| The price stays mostly below VWAP all day | Today leans weak | Same as above (4 on the chart) |
| The price swings back and forth across VWAP | No direction today | Use it as support or resistance here and it will keep being crossed (3 on the chart) |
| VWAP moves a lot after the open | Cumulative volume is still small, so new candles have a big effect | The morning VWAP is not yet stable (1 on the chart) |
| The price rallies hard in the afternoon, VWAP barely moves | Cumulative volume is already large, so new candles cannot move it | That is the calculation itself, not the indicator failing (2 on the chart) |
How to use it: three examples
Example 1: as today’s bullish or bearish backdrop
Only look for long trades when the price is above VWAP, and only for short trades when it is below. It does not tell you which candle to enter on; it only tells you which side of today’s “overall cost” the price is on.
Example 2: avoid the most unstable stretch after the open
Shortly after the open, VWAP is easily dragged along by a few high-volume candles (1 on the chart). Some traders wait until some time after the open, when VWAP has settled, before using it as a reference.
Example 3: start counting from an important point (anchored VWAP)
A standard VWAP resets every day, so it is an intraday tool. To look at a longer-term cost zone, some traders start accumulating from an important high, low or the candle when news broke, often called anchored VWAP. That is a different use: a different starting point gives a different meaning.
Common mistakes
1. Treating VWAP as a support or resistance line
VWAP is an average cost, not orders someone has placed there. On the sideways day in the chart (27 January), the price crossed it 6 times.
2. Comparing directly across platforms and sessions
A different session start, price or volume gives a different VWAP. When someone says “the price is above VWAP”, first check that you are looking at the same line.
3. Still expecting it to follow the price late in the session
The closer to the end of the session, the smaller the weight of each new candle in the average. After a big move in the afternoon, VWAP often moves only a little, just like candle 3 in the example: that is the calculation itself, not the indicator failing.
FAQ
What is VWAP?
VWAP (volume-weighted average price) multiplies each candle’s price by its volume, accumulates from the start of the session, and divides by total volume. It represents the average traded price so far in the session, and restarts with each new session.
How do you read VWAP?
A common reading is: the price staying above VWAP for a long time means the day leans strong; staying below means it leans weak; repeated crossing means no direction. It describes the day’s overall cost, not precise entry or exit points.
How is VWAP different from a moving average?
A moving average looks at the last N candles, each weighted equally (or by time); VWAP looks at everything from the start of the session until now, weighted by volume, and resets every session. For how moving averages behave, see What is a simple moving average (SMA)?
Does MT5 have VWAP?
MT5 has no built-in VWAP; you need to install a custom indicator. CFDs on MT5 mostly have only tick volume, so the resulting VWAP is an approximation.
Conclusion
VWAP is a very honest line: it tells you at what price, on average, trading has taken place so far today. It is also very stubborn: the opening candles have the final say, and the later it gets, the harder it is to move.
So the real question is: on your instrument, at what time of day is “the price being above VWAP” most useful? One stretch of historical prices cannot answer that. Backtest it with our AI Strategy Assistant and you will know.
Write the condition as one sentence, for example “go long only when the price is above the day’s VWAP two hours after the open”, give it to MASQuant’s AI Strategy Assistant, and press go to start the backtest. The backtest environment includes real market frictions such as spreads, slippage, changes in market liquidity and execution delays (see the AI Strategy Assistant guide for how to use it). A backtest tells you “how this rule performed in past market conditions”, not a guarantee about the future.
An idea only becomes a strategy once it’s been tested.
The price chart in this article is taken from historical prices on the MT5 platform (hourly, times in platform server time; quotes and daily candle cut-off times differ slightly between platforms, so values may not match exactly), and the indicators are calculated by a program using the standard formulas; the round numbers in the example are not market data. Historical prices are used only to show how the indicator behaves and do not represent future price movements.
Risk disclosure: CFDs are high-risk financial products and can lead to rapid loss of capital. Past performance does not guarantee future results. All strategies and backtests are for reference only and do not constitute investment advice. Please read our Risk Disclosure carefully before trading.


