
Does MACD Divergence Always Mean a Reversal? Divergence Is a Clue, Not a Verdict
Price makes a new high, but MACD doesn’t follow — that’s called divergence.
Many tutorials then tell you: a reversal is coming, get ready to sell.
Really?
This is part three of MASQuant’s “Trading Academy · The Truth About Indicators” series. We start with how MACD is calculated, then use a simulated stretch of market to see what price actually does after divergence sounds the alarm.
The short answer
Divergence is a clue, not a verdict.
Weakening momentum doesn’t mean an immediate reversal.
What is MACD: the distance between two moving averages
MACD (Moving Average Convergence Divergence) was introduced by Gerald Appel in the late 1970s. The name is long, but what it measures is simple: the distance between two exponential moving averages (EMAs), one fast and one slow.
(The “Divergence” in the name refers to the two averages “moving apart”; it’s a different thing from the “divergence between price and indicator” this article is about.)
An EMA differs from a regular moving average: more recent prices carry more weight, so it turns faster.
EMA = today's close × α + yesterday's EMA × (1 − α)
α = 2 ÷ (N + 1)   e.g. when N = 12, α ≈ 0.154
MACD’s most common default settings are (12, 26, 9), and it draws three things:
DIF = EMA12 − EMA26  ← distance between the fast and slow averages
Signal line = 9-period EMA of DIF  ← DIF's own average
Histogram = DIF − signal line  ← how far the distance is from its own average
In plain terms:
- DIF above the zero line means the short-term average is above the long-term one; the bigger DIF is, the further apart the two lines are.
- Histogram above the zero line means DIF is above the signal line. When the histogram turns from negative to positive, DIF has crossed above the signal line — the so-called golden cross.
The same three things, three sets of names
What trips people up most with MACD is often not the math but the names. The same three things are named differently in English, in Taiwanese charting software and in Simplified Chinese software — and the four letters “MACD” refer to a different line in each:
| Calculation | This article | Common in English | Common in Taiwanese software | Common in Simplified Chinese software |
|---|---|---|---|---|
| EMA12 − EMA26 | DIF | MACD line | DIF (difference) | DIF |
| 9-period EMA of DIF | Signal line | Signal line | MACD | DEA |
| DIF − signal line | Histogram | Histogram | OSC | MACD (bars) |
So when someone says “MACD turned positive” or “MACD divergence”, first check which line they mean. In this article, “MACD divergence” refers to divergence on the histogram.
Also, different software may draw it differently: some multiply the histogram (DIF − signal line) by 2, so the bars for the same stretch of market have different heights, though whether they grow or shrink is the same. Names and drawing methods aren’t fully standardized, so go by the legend in the software you use.
What the histogram measures: not up or down, but “acceleration”
This is the key to understanding divergence.
Histogram = DIF − signal line, and the signal line is DIF’s recent average. So the histogram answers: how much bigger is the distance between the two averages now than its own recent average?
- Trend accelerating: the distance keeps widening quickly, the current distance leaves its average far behind, and the histogram grows.
- Acceleration slowing: the distance widens more slowly or stops widening, the average (signal line) catches up, and the histogram shrinks.
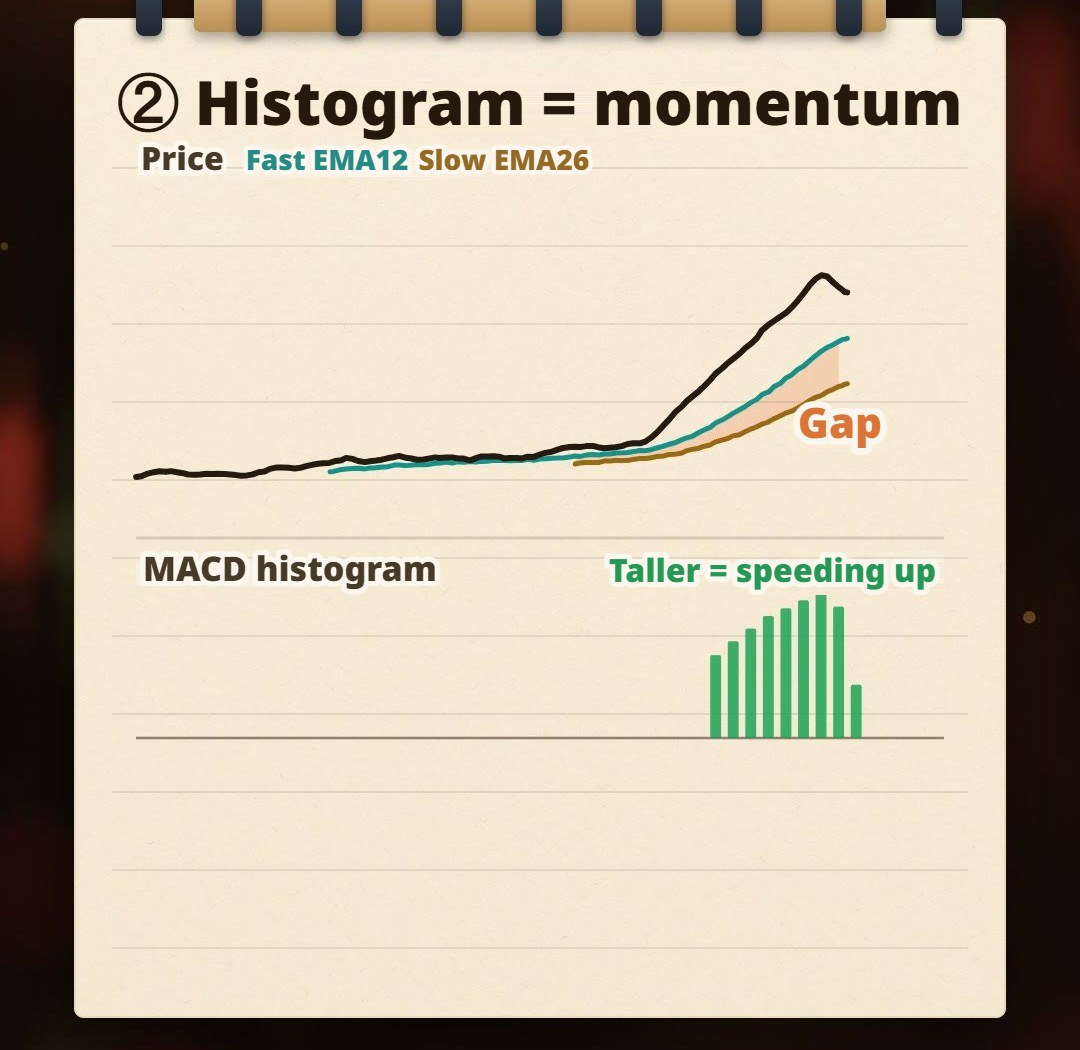
Note the second case: when the histogram shrinks, price may still be rising.
An extreme example: if price rises at a constant speed, the distance between the fast and slow EMAs eventually settles at a fixed value — DIF flattens out, the signal line catches up, and the histogram gradually shrinks to near zero. Price hasn’t fallen for a single candle, yet the histogram has almost disappeared.
So “a shrinking histogram means momentum is weakening” is more precisely: acceleration is slowing. The car is still moving forward; it’s just no longer speeding up.
What is MACD divergence: bearish and bullish divergence
Divergence is when price and the indicator point in different directions:
| Price | MACD histogram | Common reading | |
|---|---|---|---|
| Bearish divergence (at highs) | New high | Peak lower than the previous wave | Upward momentum is weakening |
| Bullish divergence (at lows) | New low | Trough shallower than the previous wave | Downward momentum is weakening |
Before reading it, three things need to be clear:
- You compare two corresponding swings. Compare the histogram peak near this wave’s price high with the peak near the previous wave’s high — not any two bars you happen to pick.
- Histogram or DIF, the results may differ. Some look at histogram peaks, others at highs in the DIF line; the histogram reacts faster than DIF and swings more, so the two may flag different divergences. Decide which one to use first, then read it with the same standard.
- Divergence can only be seen after the swing is complete. You only know a bar was the peak once the bars start shrinking; you only know it was this wave’s high once price pulls back. Neat divergence lines on charts are mostly drawn after the fact.
A simulated stretch of market: the alarm sounded three times
Let’s look at the stretch of market in the illustration. It’s a simulated market computed by a program, not the price action of a real instrument; MACD is actually calculated with (12, 26, 9).
Price pushes up in four waves, each higher than the last; the histogram below, however, peaks lower with each wave:
| Wave | Price | Histogram peak | Divergence |
|---|---|---|---|
| Wave 1 | Starts rising | 2.72 | — |
| Wave 2 | New high | 0.92 | 1st |
| Wave 3 | Another new high | 0.59 | 2nd |
| Wave 4 | Another new high | 0.27 | 3rd |
| After wave 4 | Finally falls | ||
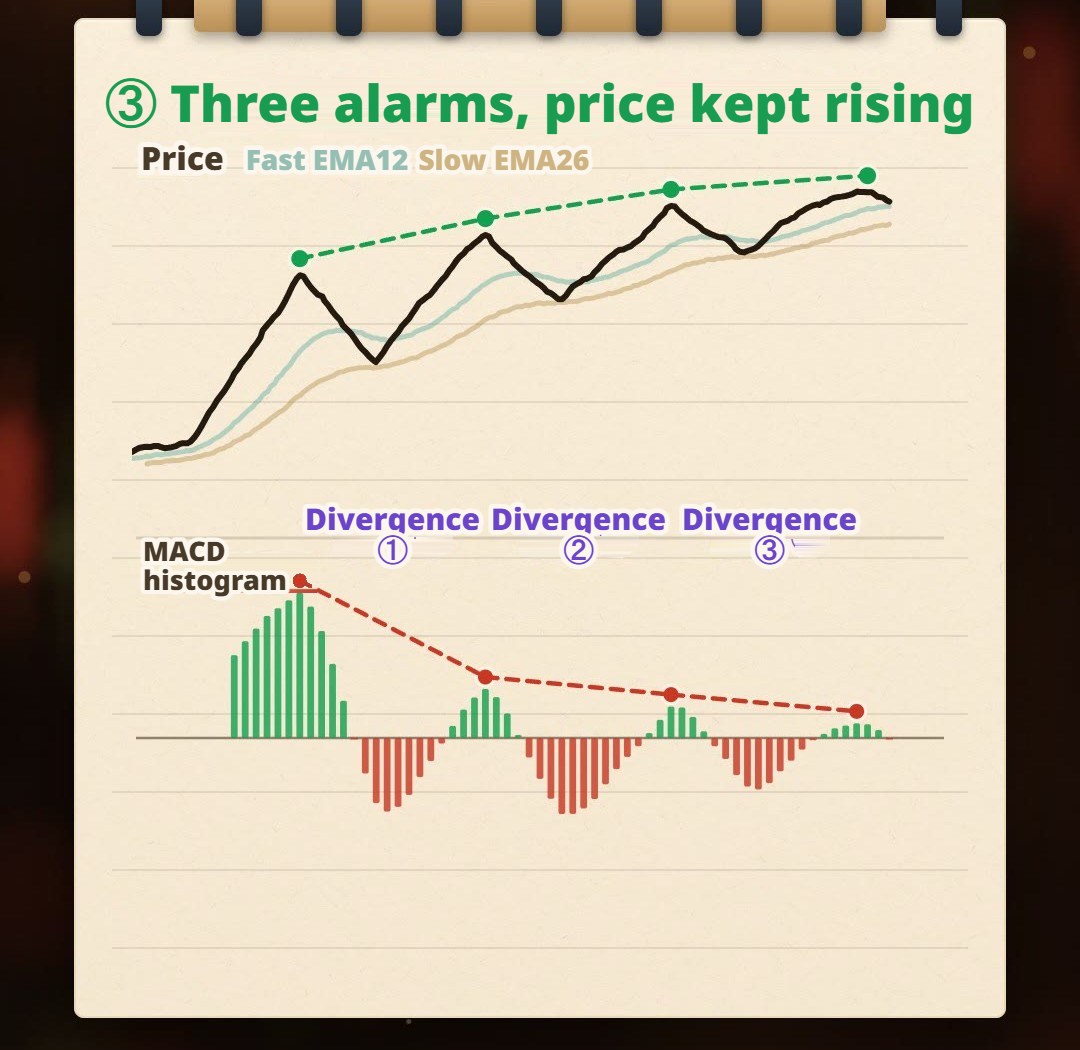
(The illustration’s histogram uses the “×2” drawing. MACD values are tied to the instrument’s price units, so numbers can’t be compared directly across instruments or software; here we only look at relative size: wave 2’s bars are about one third of wave 1’s, and wave 4’s about one tenth.)
In wave 1, the histogram is tall and strong. In wave 2, price makes a new high, but the histogram is noticeably shorter — that’s divergence. By the textbook, the alarm has sounded and it’s time to get ready to sell.
If it were you, would you sell?
Keep watching: wave 3 makes another new high with an even shorter histogram; wave 4 makes yet another new high and the histogram has almost vanished.
The alarm sounded three times, and price kept rising.
Anyone who sold at the first divergence missed the next two new highs. And if they didn’t just sell but went short, with a stop above the previous high, the next new high could have stopped them out.
Only after wave 4 did price really fall. The divergence was right in the end — it’s just that nobody knew which time it would be.
One more detail in the illustration: at each of the three divergences, DIF was still above the zero line, meaning the short-term average stayed above the long-term one. The histogram was shrinking, but the trend itself hadn’t turned down.
Why does divergence keep appearing in strong trends?
Because the histogram measures acceleration, not direction.
Late in a strong trend, this can happen: each wave still makes a new high, but each rises less than the one before — exactly as in the illustration. Price is still rising, just no longer accelerating, so the histogram naturally gets shorter wave by wave.
Once acceleration slows, price may:
- Reverse down;
- Consolidate sideways for a while, then continue;
- Keep moving in the original direction at a slower pace.
MACD itself can’t tell these three apart. It simply draws “it’s not rising as fast anymore” as bars you can see at a glance.
So what is divergence good for?
It’s a clue: a reminder that the trend is no longer accelerating, and that it’s time to watch for evidence of weakness in price itself.
Some traders treat divergence as a “start paying attention” signal, then wait for a change in price structure — such as a break below the previous swing low — before concluding the trend has changed. That’s later, and no guarantee, but at least it’s not a verdict based on a single indicator.
Common mistakes
1. Treating divergence as a reversal signal and flipping your position as soon as it appears
Divergence describes momentum, not direction. In the illustration, anyone who went short at the first divergence then had to face two more new highs.
2. Using divergence as your reason without deciding where you’d be “wrong”
Using divergence as a reason to enter or exit still requires an answer to: at what price is this judgment proven wrong? For a short based on bearish divergence, a new high in price means the “reversal is coming” judgment has been wrong, at least so far.
Without thinking this level through, when divergence sounds three times in a row you can only grit your teeth and hold on. For how to decide your stop level, see How to Set a Stop Loss? It Is Not How Much You Can Lose, It Is Where You Are Wrong.
3. Switching lines, timeframes and settings until you see divergence
No divergence on the histogram? Look at DIF. None on the daily? Switch to the 1-hour. Still none? Tweak the settings. You can always find divergence this way — but that’s reaching a conclusion first and then looking for a chart to support it.
(12, 26, 9) is the most common default. Changing settings changes where and how often divergence appears; whether a setting fits should be verified with data, not tuned until the chart shows exactly what you want to see. For more on how settings relate to strategy results, see Why Do Most Trading Strategies Fail? The Problem Might Not Be the Indicator — It’s the Parameters.
FAQ
What is MACD divergence?
When price makes a new high but the MACD histogram peak is lower than the previous wave’s, it’s bearish divergence; when price makes a new low but the histogram trough is shallower than the previous wave’s, it’s bullish divergence. It indicates that the trend’s momentum is weakening — more precisely, that “acceleration is slowing” — but not that price will reverse immediately.
Does MACD divergence always lead to a reversal?
No. In a strong trend, divergence can appear several times in a row while price keeps making new highs. In this article’s illustration, price kept rising through three consecutive divergences and only really fell after wave 4. Divergence is a clue, not a verdict.
What are DIF, the signal line and the histogram in MACD?
With the common (12, 26, 9) settings: DIF is the 12-period EMA minus the 26-period EMA (called the “MACD line” in English); the signal line is the 9-period EMA of DIF; the histogram is DIF minus the signal line. In Taiwanese charting software “MACD” usually means the signal line and the histogram is called OSC, while Simplified Chinese software calls the signal line DEA and the histogram “MACD” — so check which line a tutorial means.
Should I look at the histogram or DIF for MACD divergence?
Both are used, and the results may differ. The histogram reacts faster and swings more; the DIF line is smoother. What matters is deciding in advance which to use and reading it with the same standard — not looking at whichever one shows divergence.
Do I have to use 12, 26, 9 for MACD?
No, (12, 26, 9) is just the most common default. Changing settings changes where and how often divergence appears; whether they suit your instrument and timeframe should be verified by backtesting on historical data, not tuned until the chart happens to show the divergence you want to see.
Final thoughts
The most common misunderstanding about MACD divergence is reading “weakening momentum” as “an immediate reversal”.
A shrinking histogram means acceleration is slowing; price may then reverse, or pause and keep going. In the illustration, the alarm sounded three times before price actually turned down — and standing at the right edge of the chart, nobody knows which time this is.
So instead of asking “is divergence accurate?”, ask something more specific: on your instrument, how long after divergence does price turn? How often does divergence work? Backtest it with our AI Strategy Assistant and find out.
Write the divergence rule in your head as one sentence — for example, “exit when the histogram peak is lower than the previous wave’s and price breaks below the previous swing low” — and drop it into MASQuant’s AI Strategy Assistant to start a backtest. The backtest environment includes real-world market frictions such as spreads, slippage, changing liquidity and execution delays. The results may support your idea or overturn it — and a backtest tells you “what happened in past markets”, not that the future will be the same. Writing your judgment as rules and testing it with data is where quantitative trading begins.
Divergence is a clue, not a verdict.
An idea only becomes a strategy once it’s been tested.
Risk disclosure: CFDs are high-risk financial products and can lead to rapid loss of capital. Past performance does not guarantee future results. All strategies and backtests are for reference only and do not constitute investment advice. Please read our Risk Disclosure carefully before trading.
Further reading:


