
What Is a Simple Moving Average (SMA)? Why Moving Averages Are Always a Step Behind
“Buy when the price closes above the moving average, sell when it closes below” is probably the first trading rule most people ever learn.
What makes moving averages useful is real: they smooth out the ups and downs so you can see the direction at a glance. But they have one trait they can never shake off: a moving average is always slower than the price. This article first works through five numbers, then uses a real chart marked 1234 (Bitcoin, 2021) to explain how late it is, why it is late, and how to use that lateness.
This article is part of MASQuant’s “Trading Academy · Technical Indicators” series. All the indicators are sorted by category in Technical Indicators: The Complete Guide.
In one sentence
Simple moving average (SMA) = the average closing price of the last N candles.
The question it answers: “Over the recent stretch, roughly what level has the price been at, and which way is it heading?”
Think of it as “the average temperature of the last 20 days”. If today suddenly turns cold, the average does not drop straight away, because the 19 warmer days before it are still included; it takes several cold days for the average to fall noticeably. A moving average reads price the same way: it is steady, but it is always late.
Work it out once: five numbers are enough
Below we calculate a 5-bar moving average, SMA(5) (these are round numbers made up for the example, not market data). A “bar” here means one candle: on a daily chart one bar is one day; on a 1-hour chart one bar is one hour.
Suppose the last 8 closing prices were, in order, 10, 11, 12, 13, 14, 20, 15, 14:
| Bar | Close | The 5 bars in the average | SMA(5) |
|---|---|---|---|
| Bar 5 | 14 | 10, 11, 12, 13, 14 | 12 |
| Bar 6 | 20 | 11, 12, 13, 14, 20 | 14 |
| Bar 7 | 15 | 12, 13, 14, 20, 15 | 14.8 |
| Bar 8 | 14 | 13, 14, 20, 15, 14 | 15.2 |
Look at two things:
- On bar 6 the price jumps straight to 20, but the average only reaches 14. The other 4 old prices are still in it, pulling the average down.
- On bars 7 and 8 the price has already fallen back from 20 to 15 and 14, yet the average is still rising (14 → 14.8 → 15.2). Each new bar pushes out an older, lower price (11, then 12), while the 20 is still in the average and will not drop out for a few more bars.
That is the whole reason a moving average is “a step behind”: the price has already turned, but the average has to swap out its old prices one by one before it can catch up. The longer the period (say 60 bars), the more old prices there are to swap out, and the slower it gets.
The formula
SMA(N) = sum of the last N closing prices ÷ NWith every new candle, the oldest bar drops out and the newest one comes in, which is why it is called a “moving” average. Common periods are 5, 10, 20, 60, 120 and 200; on a daily chart the 20-day line covers roughly a month and the 60-day line roughly a quarter. In MT5 the moving average is the built-in Moving Average indicator; choose the Simple method to get an SMA.
Read the chart: Bitcoin’s 2021 high, following 1234
The chart below shows Bitcoin (BTCUSD) on the daily timeframe from June 2021 to January 2022, taken from MT5’s historical prices. Many people remember this move: a sideways range in the 30,000s over the summer, then a climb all the way to near the all-time high in November, then a fall back to the 30,000s.
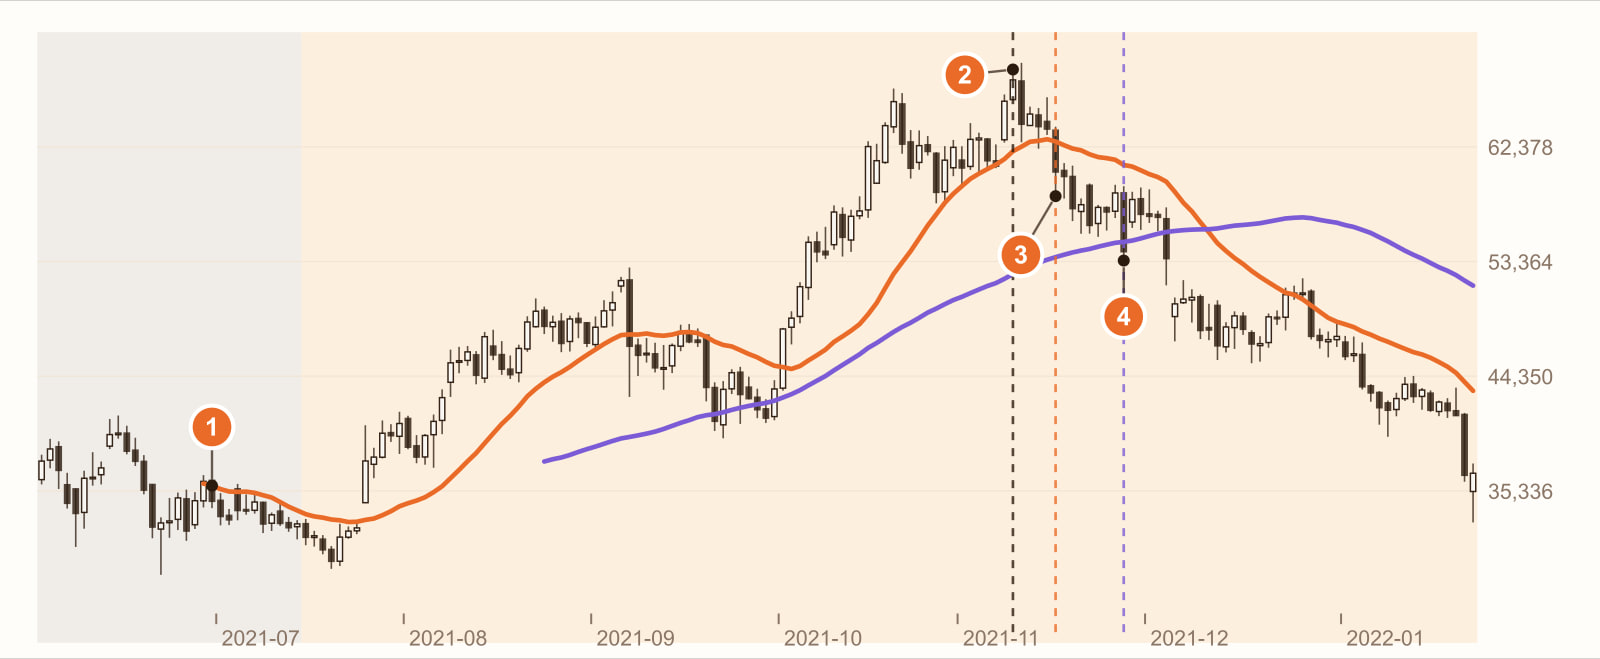
In a sideways range, the moving average gives no direction. From June to mid-July, Bitcoin closed back and forth between 32,162 and 39,880, and the 20-day line simply swung up and down with the price, showing no direction. Here, “buy above, sell below” only leads to buying and selling back and forth and taking hits both ways.
9 November: the highest close, 67,643. It had climbed all the way from 31,674 in mid-July, a gain of 113.6%. Note that both moving averages were still rising at this point. Just like bars 7 and 8 in the example above, they did not yet know the top was already in.
Close below the 20-day line: the 5th bar after the high (16 November). The close was 60,400, already 10.7% off the high. The 20-day line itself only turned down on the 4th bar after the high.
Close below the 60-day line: the 13th bar after the high (26 November). The close was 54,126, already down 20%. The 60-day line itself is even slower: it did not turn down until the 34th bar after the high (27 December).
The 20-day line turned 4 bars late, the 60-day line 34 bars late. The longer the period, the more old prices there are to swap out, and the later it is. Turn that around and the longer line is also smoother, so the price does not cut back and forth through it as often in a range. Steady and slow are two sides of the same thing. (Bitcoin then kept falling to 36,721 on 24 January 2022.)
This is a real stretch of historical prices, used to show how moving averages behave. It is not a general rule. Change the instrument, the timeframe or the period, and every number will change.
What you see, what it means
| What you see | What it usually means | But be careful |
|---|---|---|
| The average is rising and the price is mostly above it | The recent stretch leans bullish | The average lags; the top may already be in (like 2 on the chart) |
| The average is falling and the price is mostly below it | The recent stretch leans bearish | A bottom is likewise only confirmed a few bars late |
| The average is flat and the price cuts back and forth through it | A sideways range with no direction | Most “closes above” and “closes below” here are false signals (like 1 on the chart) |
| The close falls below the average | One way of saying the short term has weakened | By the time it breaks, the price is usually already some way off the high (like 34 on the chart) |
| A short average crosses above a long one (golden cross) | Short-term and medium-term direction start to agree | When both lines are flat, a cross means very little |
How to use it: three examples
Example 1: as a “direction filter”
Only look for long trades when the price is above the 60-day line and the 60-day line is rising. The moving average does not tell you which candle to enter on; its only job is to filter out trades that go against the bigger direction.
Example 2: as an “exit line”
After going long, exit when the price closes below the 20-day line. The upside is a clear rule with no guessing; the cost is what you see at 3 on the chart: you exit a few bars after the top and give back part of the move. Switch to the 60-day line and you get shaken out less often, but you give back more (4 on the chart).
Example 3: match the period to your holding time
If you plan to hold a trade for a few days, a 200-day line will give signals too slow to mean anything; if you plan to hold for months, a 5-day line will shake you out on every small swing. The period should be roughly on the same scale as your holding time. Also, “exit when the price closes below the moving average” is itself a kind of stop loss, only it sits where the moving average is, which is not necessarily where you are proved wrong. For how to weigh the two, see How to Set a Stop Loss?
Common mistakes
1. Treating the moving average as a support or resistance “wall”
A moving average is an average of past prices, not orders someone has placed there. When the price bounces off a moving average, sometimes it is because many people are watching the same line and sometimes it is just coincidence; plenty of times the price simply cuts straight through it.
2. Switching periods over and over to find the “most accurate” one
Try 18, 23 and 37 days on the same stretch of prices and you can always find one that looks best on the past, but it very likely just happens to fit that stretch and stops working on the next one. See Why Do Most Trading Strategies Fail?
3. Watching only the crosses, not the direction of the lines
A short average crossing a long one (golden cross, death cross) happens again and again in a range. A cross that appears while both lines are flat means far less than one that appears while both lines point the same way.
FAQ
What is a moving average?
A moving average is a line drawn by averaging the closing prices of a recent period, recalculated every time a new candle appears. The most common one is the simple moving average (SMA): the sum of the last N closing prices divided by N. For example, if the last 5 closes are 10, 11, 12, 13 and 14, the SMA(5) is 12.
Why does a moving average lag?
Because every point on a moving average contains the prices of the past N bars. After the price changes direction, the old prices are still in the average, and the moving average only turns once they have gradually been replaced by new prices. The longer the period, the more old prices there are to replace, and the bigger the lag.
What is the difference between an SMA and an EMA?
In an SMA every price carries the same weight; an EMA (exponential moving average) gives recent prices more weight, so it turns faster but is also more easily pulled around by short-term swings. See EMA (exponential moving average) for details.
How do I choose between the 20-day, 60-day and 200-day lines?
There is no standard answer. The shorter the period, the more sensitive and the noisier the line; the longer, the smoother and the slower. A common approach is to keep the period on the same scale as your holding time, then use backtests to compare how different periods perform on your instrument.
How do I add a moving average in MT5?
MT5 has a built-in Moving Average indicator. In its settings, choose Simple as the method for an SMA or Exponential for an EMA, and set the period in the Period field.
Conclusion
The lag of a moving average is real, and so is its steadiness. The few times you avoid being shaken out on the 60-day line and the few percent you give back on the 60-day line are two sides of the same choice.
So the question to ask is not “which moving average is the most accurate”, but: on your instrument, how slow a moving average gives you the best trade-off? One stretch of historical prices cannot answer that. Backtest it with our AI Strategy Assistant and you will know.
Write the condition as one sentence, for example “enter when the price closes above the 20-day line, exit when it closes below”, give it to MASQuant’s AI Strategy Assistant, and press go to start the backtest. The backtest environment includes real market frictions such as spreads, slippage, changes in market liquidity and execution delays (see the AI Strategy Assistant guide for how to use it). Then change 20 to 60 and run it again, and you can compare how the two kinds of “slow” differ on your instrument. A backtest tells you “how this rule performed in past market conditions”, not a guarantee about the future.
An idea only becomes a strategy once it’s been tested.
The price chart in this article is taken from historical prices on the MT5 platform (daily; quotes and daily candle cut-off times differ slightly between platforms, so values may not match exactly), and the indicators are calculated by a program using the standard formulas; the round numbers in the example are not market data. Historical prices are used only to show how the indicator behaves and do not represent future price movements.
Risk disclosure: CFDs are high-risk financial products and can lead to rapid loss of capital. Past performance does not guarantee future results. All strategies and backtests are for reference only and do not constitute investment advice. Please read our Risk Disclosure carefully before trading.


