
What Is an EMA? The Exponential Moving Average Is Faster, but What Does That Cost?
“The EMA is faster, so it’s better?”
Set both to 20 bars and an EMA (exponential moving average) usually turns before an SMA. That is true, and the reason is simple: it gives recent prices more weight. But “fast” is never free. This article works out both moving averages once on the same numbers, then uses a real chart marked 1234 (the S&P 500 in 2020) to show where the benefit of speed lies and where its cost lies.
This article is part of MASQuant’s “Trading Academy · Technical Indicators” series. All the indicators are sorted by category in Technical Indicators: The Complete Guide.
In one sentence
EMA (exponential moving average) = a moving average that counts newer prices more heavily.
It answers the same question as the SMA: “Roughly where has the price been lately, and which way is it going?” It just cares more about what happened most recently.
Think of two ways to work out a term grade. The SMA is “every exam counts the same”; the EMA is “recent exams count more”. Do well recently and the EMA grade looks good straight away; have one bad day recently and the EMA shows that straight away too. It reacts fast, and is also more easily carried along by a single accident.
Work it out once: same numbers, two averages
Take the same closing prices as in the SMA article: 10, 11, 12, 13, 14, 20, 15, 14 (these are round numbers made up for the example, not market data), and calculate a 5-bar SMA and a 5-bar EMA.
For a 5-bar EMA, the weight of the new price is 2 ÷ (5 + 1) = ⅓. The calculation is: today’s EMA = today’s close × ⅓ + yesterday’s EMA × ⅔. The first EMA starts from the simple average of the first 5 bars.
| Bar | Close | SMA(5) | How EMA(5) is calculated | EMA(5) |
|---|---|---|---|---|
| Bar 5 | 14 | 12 | Start: average of the first 5 bars | 12 |
| Bar 6 | 20 | 14 | 20 × ⅓ + 12 × ⅔ | 14.67 |
| Bar 7 | 15 | 14.8 | 15 × ⅓ + 14.67 × ⅔ | 14.78 |
| Bar 8 | 14 | 15.2 | 14 × ⅓ + 14.78 × ⅔ | 14.52 |
- Bar 6, the price jumps to 20: the EMA jumps to 14.67, while the SMA only reaches 14. The new price makes up a third of the EMA but only a fifth of the SMA, so the EMA follows faster.
- Bar 8, the price has already fallen back: the EMA has already turned down (14.78 → 14.52), while the SMA is still rising (14.8 → 15.2). That is where “the EMA turns before the SMA” comes from.
Now think about it the other way: if bar 9 suddenly jumped back to 20, the EMA would be pulled straight back up too, and the turn it just made would reverse. Being sensitive to new prices means getting shaken around constantly in a choppy, back-and-forth market.
The formula
k = 2 ÷ (N + 1)
Today's EMA = today's close × k + yesterday's EMA × (1 − k)
With the most common N = 20, k = 2 ÷ 21 ≈ 0.095. In EMA20, the latest close makes up about 9.5%, the one before about 8.6%, the one before that about 7.8%… the older the price, the smaller its weight, but it never disappears completely. In SMA20, every bar is 5%, and prices before the 21st bar do not count at all.
The first EMA is usually seeded with the simple average of the first N bars, so the values in the early stretch can differ slightly depending on where the calculation starts. In MT5, the EMA is the built-in Moving Average; choose the Exponential method to get an EMA.
Read the chart: before and after the 2020 Covid crash, following 1234
The chart below shows the S&P 500 index (US500) on the daily timeframe from August 2019 to March 2020, taken from MT5’s historical prices. It moved sideways in the autumn of 2019, then climbed all the way to mid-February 2020, followed by the Covid-driven crash: down 30.1% from the high to 19 March.
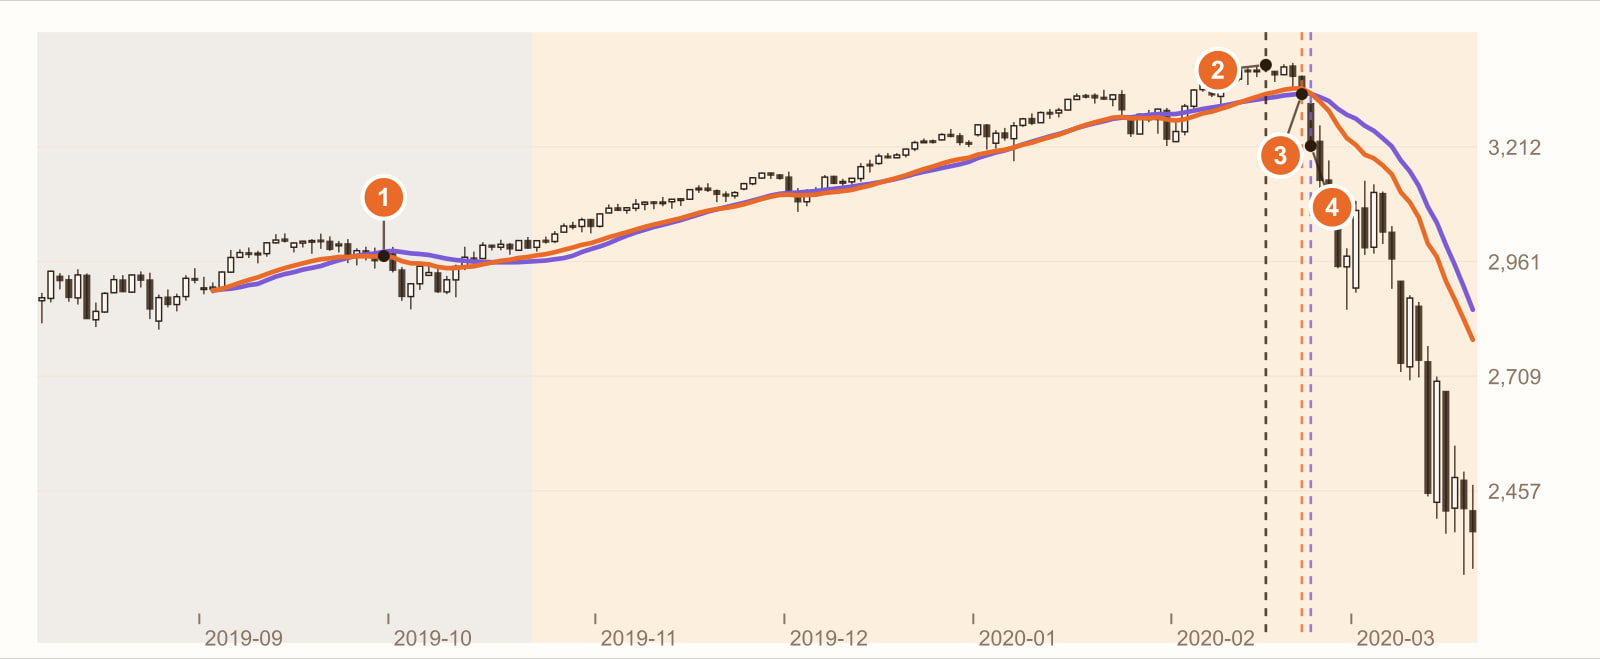
In the range, the EMA is noisier. In the sideways range from August to October 2019, the price crossed EMA20 6 times and SMA20 4 times. The EMA hugs the price more closely, so the price slips through it at the slightest wobble; if “enter and exit on a cross” is your rule, the EMA also gives more false signals.
17 February 2020: the highest close, 3,388. This is the closing high in this data set (platforms cut daily candles differently, so the date of the high may differ by a day). After it, EMA20 turned down on the 3rd bar and SMA20 on the 4th.
Close below EMA20: the 4th bar after the high (21 February). The close was 3,340, only 1.4% off the high.
Close below SMA20: the 5th bar after the high (24 February). The close was 3,227, already 4.8% off. Only one bar apart, but that one bar fell 3.4% in a single day, and the gap opened up. In this stretch, the EMA told you one bar earlier and saved you from giving back a big chunk.
1 and 34 are two sides of the same thing: the EMA hugs the price closely, so it is a step earlier when the trend turns (3); and because it hugs the price closely, it gets cut back and forth in a range (1).
This is a real stretch of historical prices, used to show how the EMA and the SMA behave. It is not a general rule. Change the instrument, the timeframe or the period, and every number will change. Nor is the EMA always broken earlier at every top.
What you see, what it means
| What you see | What it usually means | But be careful |
|---|---|---|
| The EMA has turned, the SMA has not yet | The last few bars have started to weaken (or strengthen) | It may just be one or two bars of noise that turn back a few bars later |
| The price cuts back and forth through the EMA | A sideways range that is shaking the EMA (like 1 on the chart) | Most crosses here are false signals |
| The close falls below the EMA but not yet below the SMA | The first warning that the short term is weakening (like 3 on the chart) | It comes earlier, and is also wrong more often |
| The EMA is above the SMA and both are rising | Recent prices are stronger than the average, leaning bullish | This is also what the end of a trend often looks like; it cannot show where the top is |
How to use it: three examples
Example 1: Is your bigger fear being “late” or being “shaken out”?
If you fear exiting too late and giving back too much, the EMA suits you better (3 on the chart comes before 4); if you fear being whipsawed again and again in a range, the SMA or a longer period suits you better (fewer crosses at 1 on the chart). This is not about which is right, but about which kind of mistake you can live with.
Example 2: the long one for direction, the short one for entries and exits
A common combination: use a long-period moving average (for example a 60-day SMA) to decide whether to trade only long or only short, then use a short-period EMA (for example EMA20) to time entries and exits. The long one filters out trades against the trend; the short one is there to react quickly.
Example 3: add a confirmation condition
For example, require “two consecutive closes on the same side of the EMA” before it counts. The more conditions, the fewer false signals, but also the slower it gets: once again a trade-off between fast and steady.
Common mistakes
1. Thinking the EMA is “more accurate”
The EMA is only faster, not more accurate. It tells you a little earlier that the price has turned, and it also tells you a little earlier, and more often, about turns that never actually happen.
2. Making the EMA period very short to get in even earlier
EMA10 and EMA5 are faster, but they also hug the price even more closely, so almost every small wobble crosses them. Take it far enough and the moving average is just the price itself.
3. Comparing an EMA and an SMA with the same number directly
EMA20 and SMA20 both have 20 in the name, but they are calculated differently and sit in different places on the chart. When someone says “the price is above the 20-day line”, first check which one they mean.
FAQ
What is an EMA?
An EMA (exponential moving average) is a moving average that gives recent prices more weight. Each new price is multiplied by k = 2 ÷ (N + 1) and added to the previous EMA multiplied by (1 − k). In EMA20, for example, the latest price carries about 9.5% of the weight, while in SMA20 every bar carries 5%.
Which is better, the EMA or the SMA?
Neither is better in absolute terms. The EMA turns faster and stays closer to the price, but in a range it is also crossed more easily; the SMA is smoother and slower. Which one suits you depends on your instrument and your way of trading, and the best way to find out is to compare them with a backtest.
Where does the EMA’s k value come from?
k = 2 ÷ (N + 1) is the most common setting; it gives an N-bar EMA roughly the same average “age” as an N-bar SMA. The larger N is, the smaller k is, the less a new price counts, and the smoother the EMA. For example, k is ⅓ when N = 5 and about 0.095 when N = 20.
What are the common EMA periods?
Common ones are 9, 12, 20, 26, 50 and 200. 12 and 26 are the two EMAs MACD uses by default; for MACD’s trade-offs, see Does MACD divergence always mean a reversal?
Conclusion
The EMA’s speed is real: at a top, it turns and is broken before the SMA. The EMA’s noise is real too: in a range, the price crosses it more often than the SMA. Both come from the same weighting design, and you cannot have just half of it.
So the real question is: on your instrument, does what you save by exiting a few bars earlier pay for the extra times you get shaken out in a range? One stretch of historical prices cannot answer that. Backtest it with our AI Strategy Assistant and you will know.
Write the condition as one sentence, for example “enter when the price closes above EMA20, exit when it closes below”, give it to MASQuant’s AI Strategy Assistant, and press go to start the backtest. The backtest environment includes real market frictions such as spreads, slippage, changes in market liquidity and execution delays (see the AI Strategy Assistant guide for how to use it). Then switch the EMA to an SMA and run it again; comparing the two will tell you. A backtest tells you “how this rule performed in past market conditions”, not a guarantee about the future.
An idea only becomes a strategy once it’s been tested.
The price chart in this article is taken from historical prices on the MT5 platform (daily; quotes and daily candle cut-off times differ slightly between platforms, so values may not match exactly), and the indicators are calculated by a program using the standard formulas; the round numbers in the example are not market data. Historical prices are used only to show how the indicator behaves and do not represent future price movements.
Risk disclosure: CFDs are high-risk financial products and can lead to rapid loss of capital. Past performance does not guarantee future results. All strategies and backtests are for reference only and do not constitute investment advice. Please read our Risk Disclosure carefully before trading.



Comment
What Is the TRIX Indicator? Triple Exponential Average Formula, Worked Example, Zero Line and Signal Line
October 27, 2026[…] What Is an EMA? The Exponential Moving Average Is Faster, but What Does That Cost? […]