
How to Read the Ichimoku Cloud: Five Lines and a Cloud, and Almost All of Them Are Midpoints of Highs and Lows
“The Ichimoku cloud has turned up, so the market is going to rise.”
The Ichimoku chart often puts beginners off: five lines and a cloud that extends out to the right, looking as if it were predicting the future. In fact its make-up is quite plain: four of the five lines are “the midpoint between the highest and lowest price over a period”. This article first works out each of the five lines once in a single table, then uses a real chart marked 1 to 4 (USD/JPY, 2025) to show what it looks like in a range and in a trend.
This article is part of MASQuant’s “Trading Academy · Technical Indicators” series. All the indicators are sorted by category in Technical Indicators: The Complete Guide.
In one sentence
Ichimoku = three “range centres”, short-term, medium-term and long-term, drawn on the same chart.
The question it answers: “Is the current price above or below the centres of the recent ranges?”
On a daily chart, think of it as three questions asked together: where is the midpoint of the price range over the last 9 days? Over the last 26 days? Over the last 52 days? If the price is above all three midpoints, it leans strong; below, it leans weak; caught in between, the direction is unclear. The cloud simply shifts two of those midpoints a stretch to the right so they are easy to compare with later prices.
Work it out once: five lines, one table
The usual settings are 9, 26 and 52 (the highs and lows below are round numbers made up for the example, not market data):
| Line | Which stretch | Calculation | Result | Where it is drawn |
|---|---|---|---|---|
| Conversion Line (Tenkan-sen) | Last 9 bars: high 108, low 102 | (108 + 102) ÷ 2 | 105 | Today |
| Base Line (Kijun-sen) | Last 26 bars: high 110, low 96 | (110 + 96) ÷ 2 | 103 | Today |
| Leading Span A (Senkou Span A) | The Conversion and Base Lines | (105 + 103) ÷ 2 | 104 | Shifted 26 bars to the right |
| Leading Span B (Senkou Span B) | Last 52 bars: high 112, low 90 | (112 + 90) ÷ 2 | 101 | Shifted 26 bars to the right |
| Lagging Span (Chikou Span) | Today’s close | No calculation needed | Today’s close | Shifted 26 bars to the left |
So at the position “26 bars ahead”, the cloud drawn there is the band between 101 and 104. It looks as if it is drawn in the future, but every number used to calculate it is a high or low from today or earlier.
Notice one more thing: if the next few bars make neither a new high nor a new low, the highest and lowest of the last 9 bars do not change, and the Conversion Line stays at 105. That is why, in a range, the Conversion and Base Lines often turn into stepped, horizontal segments. This is the biggest difference from an ordinary moving average: a moving average averages closing prices and moves a little with every bar; Ichimoku uses midpoints of highs and lows, and does not move if the highs and lows do not change.
The formula
Conversion Line = (highest of last 9 bars + lowest of last 9 bars) ÷ 2
Base Line = (highest of last 26 bars + lowest of last 26 bars) ÷ 2
Leading Span A = (Conversion Line + Base Line) ÷ 2, plotted 26 bars forward (into the future)
Leading Span B = (highest of last 52 bars + lowest of last 52 bars) ÷ 2, plotted 26 bars forward
Lagging Span = close, plotted 26 bars back (into the past)
The shaded area between Leading Span A and B is what everyone calls the “cloud”. The Lagging Span draws today’s close 26 bars back, to compare “today’s price” with “the price 26 bars ago”.
Ichimoku Kinko Hyo was developed by Goichi Hosoda of Japan (pen name Ichimoku Sanjin) and formally published in 1969. In MT5 it is the built-in Ichimoku Kinko Hyo, with default settings of 9, 26 and 52.
Read the chart: the yen in 2025, following 1 to 4
The chart below shows USD/JPY (USDJPY) on the daily timeframe from April 2025 to February 2026, taken from MT5’s historical prices. For almost half a year it moved back and forth between 141.96 and 150.75, then from October it climbed steadily, closing at 159.09 on 13 January 2026. The stretch on the far right with a cloud but no candles is the 26 bars plotted into the future.
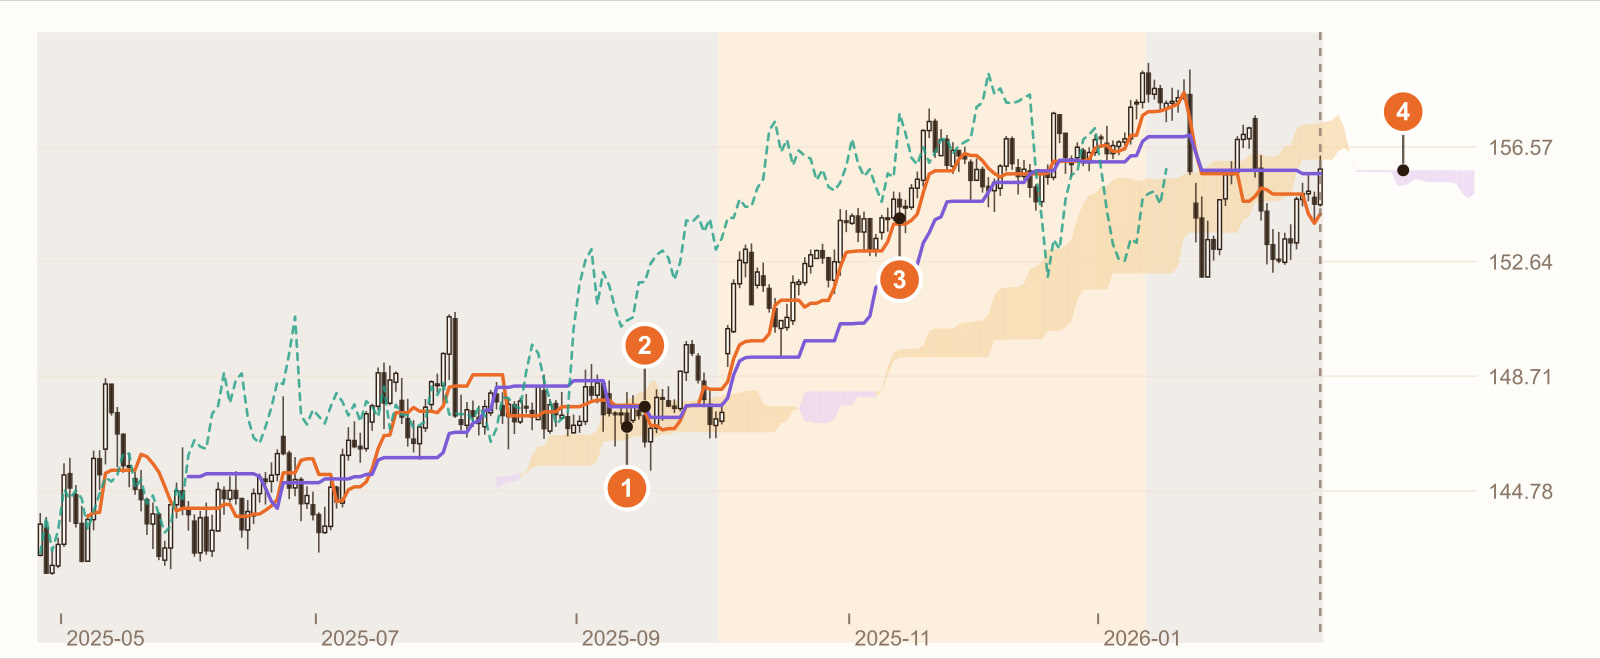
In the range, the price churns inside the cloud (11 September 2025). Of the 38 candles in the later part of the range for which a cloud can already be drawn, 14 closed inside the cloud, and the cloud itself is thin and flat. When the price is inside the cloud, the direction is “unclear”.
In the range, the Conversion and Base Lines cross (16 September). Both lines are stepped horizontal segments, so the slightest price move makes them cross. Over the whole range they crossed 6 times, and not once did a direction emerge.
In the rally, the price stays above the cloud (13 November). Of the 72 bars from 3 October to 13 January 2026, 71 closed above the cloud. The cloud also turned to slope upward.
The cloud drawn in the future. The stretch on the far right without candles looks as if it is saying “this is where future support will be”. But it was calculated from highs and lows up to today and then shifted 26 bars to the right, just like Leading Spans A and B in the table above. By the time the price actually gets there, the market may well have changed.
This is a real stretch of historical prices, used to show how Ichimoku behaves. It is not a general rule. Change the instrument, the timeframe or the period, and every number will change.
What you see, what it means
| What you see | What it usually means | But be careful |
|---|---|---|
| Price above the cloud | The price is above the medium- and long-term range centres, leaning bullish | A similar idea to “the price is above a long-term moving average”, and it lags in the same way |
| Price below the cloud | Leaning bearish | Same as above |
| Price inside the cloud | Direction unclear (1 on the chart) | Crosses of any kind here mostly do not follow through |
| Conversion Line crosses above the Base Line | The short-term range centre is above the medium-term one | In a range this happens again and again (2 on the chart) |
| A thick cloud | A large high-low spread over that period | Thick does not mean “strong support”, only a wide range |
| The future cloud turns up | The range centres over the past stretch are moving up | Not a forecast; all the data is in the past (4 on the chart) |
How to use it: three examples
Example 1: first see where the price is relative to the cloud
The most common and simplest use: only look for long trades when the price is above the cloud, only for short trades when it is below, and do nothing while it is inside. In effect, you hand the question “is this a range right now?” over to the cloud.
Example 2: a cross depends on where it happens
The Conversion Line crossing above the Base Line means different things above the cloud, inside it and below it. Many traders only take “upward crosses above the cloud”, filtering out the back-and-forth crosses in a range (2 on the chart).
Example 3: should you change the settings?
The 9, 26, 52 settings were designed by Goichi Hosoda for the Japanese market of his day, on daily charts. Whether they suit CFDs that trade 24 hours a day, or hourly charts, is something you need to test yourself.
Common mistakes
1. Treating the future cloud as a prophecy
The cloud is drawn 26 bars ahead to make comparison easier, not because it knows the future. All of its data comes from the past.
2. Entering only when every condition is met at once
Price above the cloud, Conversion Line above the Base Line, Lagging Span above the price, cloud rising… By the time all the conditions are met, the trend has often already run a long way. The more conditions, the fewer and later the signals.
3. Watching the crosses in a range
In a range, the Conversion and Base Lines are often two horizontal lines, and the slightest wobble makes them cross. In the range on the chart, they crossed 6 times.
FAQ
What is the Ichimoku cloud?
Ichimoku is an indicator developed by Goichi Hosoda of Japan. It is made up of the Conversion Line, the Base Line, Leading Span A, Leading Span B and the Lagging Span, with usual settings of 9, 26 and 52. Most of its lines are the midpoint between the highest and lowest price over a period: for example, if the last 9 bars have a high of 108 and a low of 102, the Conversion Line is 105.
How do you read the Ichimoku cloud?
The cloud is the area between Leading Span A and Leading Span B, plotted 26 bars into the future. A common reading is that the price above the cloud leans bullish, below it leans bearish, and inside it the direction is unclear; the thicker the cloud, the larger the high-low spread over that range.
Are Conversion Line and Base Line crosses useful?
A cross means the short-term range centre has crossed the medium-term one, similar to a moving-average cross. It is more useful in a trend and tends to happen over and over in a range. For how moving averages behave, see What is a simple moving average (SMA)?
What is the Lagging Span?
The Lagging Span is today’s close plotted 26 bars back, used to compare today’s price with the price 26 bars ago. When the Lagging Span is above the price at that time, the price now is higher than it was 26 bars ago.
Conclusion
Ichimoku looks complicated, but it is really a “range map” built from midpoints of highs and lows: short-, medium- and long-term range centres, plus a way of shifting them forward and back for comparison.
So the real question is: on your instrument, does the condition “price above the cloud” actually help you avoid ranges? One stretch of historical prices cannot answer that. Backtest it with our AI Strategy Assistant and you will know.
Write the condition as one sentence, for example “enter when the price closes above the cloud and the Conversion Line crosses above the Base Line”, give it to MASQuant’s AI Strategy Assistant, and press go to start the backtest. The backtest environment includes real market frictions such as spreads, slippage, changes in market liquidity and execution delays (see the AI Strategy Assistant guide for how to use it). A backtest tells you “how this rule performed in past market conditions”, not a guarantee about the future.
An idea only becomes a strategy once it’s been tested.
The price chart in this article is taken from historical prices on the MT5 platform (daily; quotes and daily candle cut-off times differ slightly between platforms, so values may not match exactly), and the indicators are calculated by a program using the standard formulas; the round numbers in the example are not market data. Historical prices are used only to show how the indicator behaves and do not represent future price movements.
Risk disclosure: CFDs are high-risk financial products and can lead to rapid loss of capital. Past performance does not guarantee future results. All strategies and backtests are for reference only and do not constitute investment advice. Please read our Risk Disclosure carefully before trading.


