
What Is the Aroon Indicator? It Only Counts Days, Not How Far the Price Has Risen
“Aroon Up has hit 100. Is a new rally starting?”
First, look at what Aroon actually measures: it doesn’t care how far the price has risen; it only counts “how many days since the last new high”. If today sets a new 25-day high, Aroon Up is 100, whether the new high is 10% above the old one or just 0.1%. This article first works it out once with a table, then uses a real chart marked 1 to 4 (Bitcoin, second half of 2024) to show what it looks like in a range and in a trend.
This article is part of MASQuant’s “Trading Academy · Technical Indicators” series. All the indicators are sorted by category in Technical Indicators: The Complete Guide.
In one sentence
Aroon = how “fresh” a trend is: how many days ago did the most recent high and the most recent low appear?
The closer Aroon Up is to 100, the fresher the new high; the closer Aroon Down is to 100, the fresher the new low.
Aroon is like the use-by date on food in your fridge: it only records “which day this high was put in”, not “how big a portion it is”. A high set today scores 100; after 12 days it is down to 52; if a full 25 days pass without a fresh one, it is at 0. So Aroon is good at answering “is the trend still fresh?” and not suited to answering “how strongly is it rising?”
Work it out once: every extra day costs 4 points
Aroon has two lines, and the usual period is 25:
- Aroon Up: how many bars ago did the highest high of the last 25 bars appear?
- Aroon Down: how many bars ago did the lowest low of the last 25 bars appear?
The calculation is a single line: (25 − bars since) ÷ 25 × 100. Here is an Aroon Up example (the following are round numbers made up for the example, not market data):
| The highest high of the last 25 bars appeared | Calculation | Aroon Up |
|---|---|---|
| Today | (25 − 0) ÷ 25 × 100 | 100 |
| 1 bar ago | (25 − 1) ÷ 25 × 100 | 96 |
| 5 bars ago | (25 − 5) ÷ 25 × 100 | 80 |
| 10 bars ago | (25 − 10) ÷ 25 × 100 | 60 |
| 20 bars ago | (25 − 20) ÷ 25 × 100 | 20 |
| 25 bars ago | (25 − 25) ÷ 25 × 100 | 0 |
The table shows two things. First, as long as there is no new high, Aroon Up loses a fixed 4 points with every bar (100 ÷ 25), which plots as a perfectly straight line sloping down. Second, there is no price in the formula. Whether the new high beats the old one by 10 dollars or by 10 cents, the result is 100.
The formula
The usual setting is 25:
1 Aroon Up   = (25 − bars since the highest high of the last 25 bars) ÷ 25 × 100
2 Aroon Down = (25 − bars since the lowest low of the last 25 bars) ÷ 25 × 100
3 Aroon Oscillator = Aroon Up − Aroon Down
Aroon was introduced by Tushar Chande in 1995. The name comes from Sanskrit and means “the first light of dawn”: what he was looking for was the moment a trend begins. A common reading is that Aroon Up above 70 with Aroon Down below 30 leans bullish, and the reverse leans bearish; when the two lines cross, “the fresher side” has changed hands. These are just customary reference lines, not hard boundaries.
MT5 has no built-in Aroon, so you need to install a custom indicator. Some charting platforms use a default period of 14 rather than 25; before comparing values across platforms, check that the period is the same.
Read the chart: Bitcoin in the second half of 2024, following 1 to 4
The chart below shows Bitcoin (BTCUSD) on the daily timeframe from late July 2024 to early January 2025, taken from MT5’s historical prices (Bitcoin is quoted at weekends too, so 25 bars here means 25 days). It went through a range, a rally and choppy trading near the highs, in that order: from 28 July to 19 October, it closed between 52,828 and 68,384, with the first and last closes only 0.4% apart; from 20 October to 27 November, it rose from 68,734 to 96,227, a gain of 40%; after that it closed between 92,035 and 106,371.
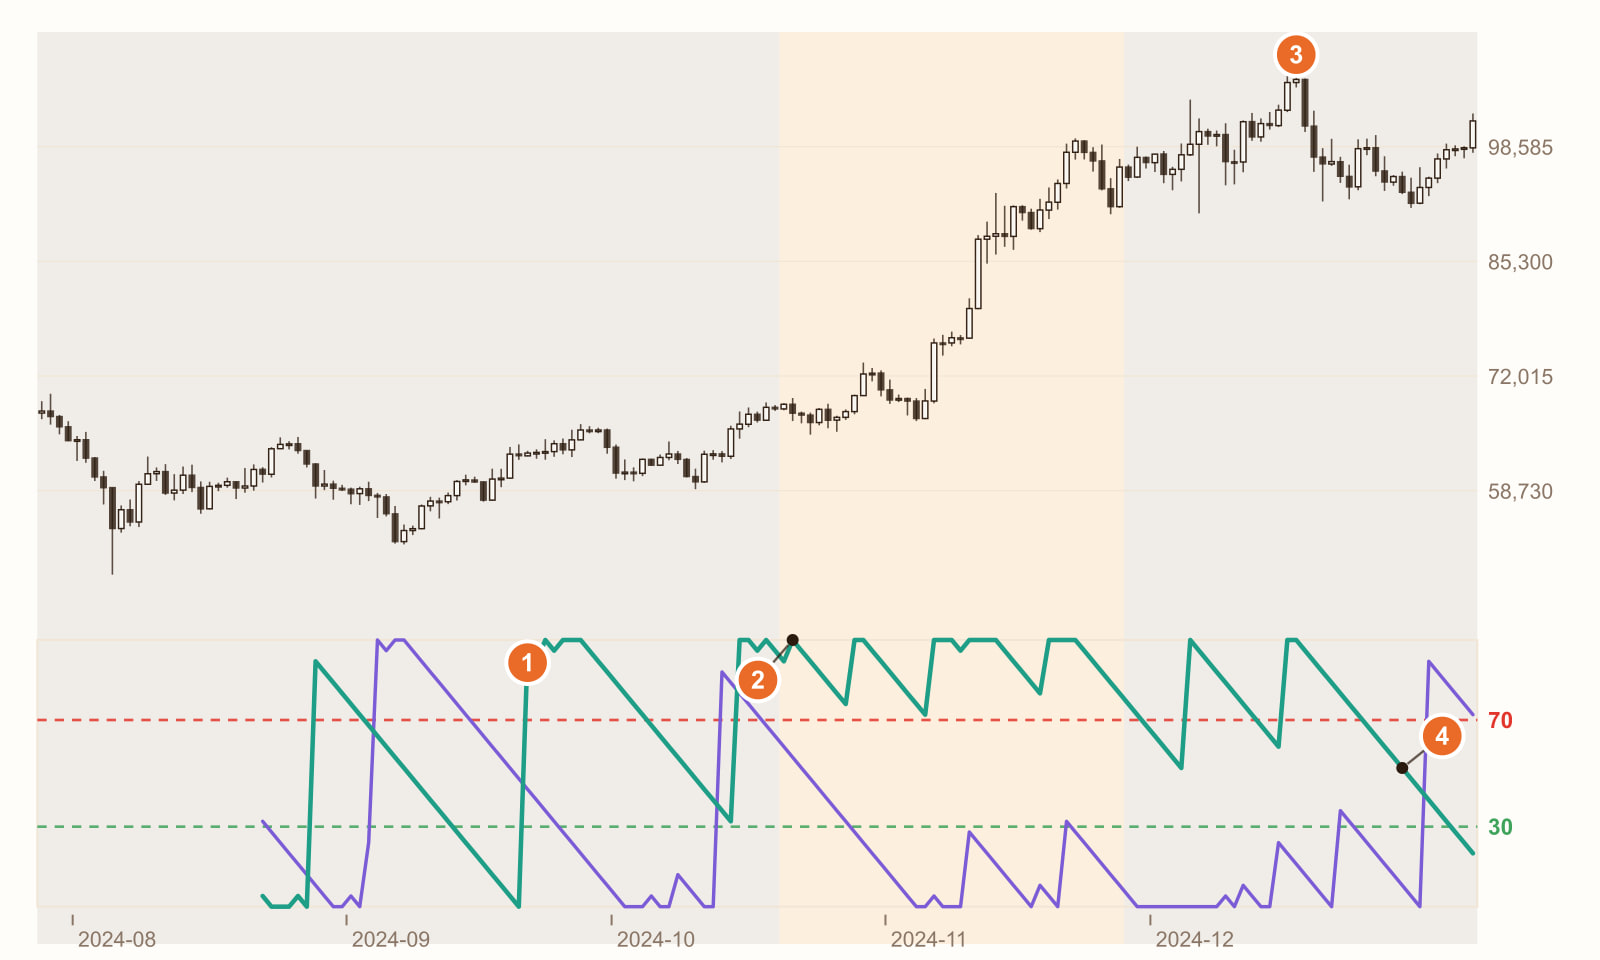
In the range, the two lines keep crossing (21 September 2024). During the range from late July to mid-October, Aroon Up and Aroon Down crossed 5 times; Aroon Up hit 100 on 4 occasions, and Aroon Down did so twice. Each of those 100s only meant “a new 25-day high (or low)”. The clearest case was 25 September: the new high was just 0.11% above the previous highest price, and Aroon Up still read 100.
On the second day of the rally, Aroon Up was already 100 (21 October 2024). From that day until the rally ended on 27 November, Aroon Up stayed above 70 on all 39 candles. In a smooth trend, Aroon is easy to read: the new highs keep being replaced, so Aroon Up stays pinned to the top.
The last high: 17 December 2024, a high of 108,312. By then the rally had been over for 20 days and the price was swinging around at high levels, but every time it set a new high now and then, Aroon Up could go back to 100. From Aroon alone, you cannot tell whether “the rally is still going” or “the price is just churning near the top”.
After the high, it loses 4 points a day (29 December 2024: 52). After 17 December there was no new high right up to the last day on the chart (6 January 2025), and Aroon Up fell all the way from 100 to 20 in a straight line: 52 after 12 days, 20 after 20 days. Over that stretch the price went both down and up; Aroon Up simply followed the calendar down.
This is a real stretch of historical prices, used to show how Aroon behaves. It is not a general rule. Change the instrument, the timeframe or the period, and every number will change.
What you see, what it means
| What you see | What it usually means | But be careful |
|---|---|---|
| Aroon Up above 70, Aroon Down below 30 | New highs keep coming; leaning bullish | It only means the new highs are fresh, not that the price has risen a lot (1 on the chart: a new high just 0.11% higher still scores 100) |
| Aroon Down above 70, Aroon Up below 30 | New lows keep coming; leaning bearish | Same as above: it tells you about time, not size |
| The two lines cross | The fresher side has changed hands | In a range they cross over and over (5 crossings in the stretch at 1 on the chart) |
| Aroon Up falls in a straight line from 100 | No new high for a while | That is simply the shape of the formula, a fixed 4 points a day; the price may still be near its highs (4 on the chart) |
| Both lines below 50 | Neither a new high nor a new low lately | Common in consolidation; direction still unclear |
How to use it: three examples
Example 1: as a “trend freshness” filter
The rule can be written as: “Only go long with trend-following methods when Aroon Up is above 70 and Aroon Down is below 30.” It helps you avoid one situation: the price still looks high, but it has actually gone several weeks without a new high.
Example 2: use the Aroon Oscillator to see which side has the upper hand
Aroon Up minus Aroon Down ranges from −100 to +100. Above +50 leans bullish, below −50 leans bearish, and swinging back and forth around 0 means neither side is fresh. For example: “Only go long when the Aroon Oscillator is above 50, and exit when it falls back below 0.”
Example 3: add a confirmation to crossover signals
Crossovers alone will keep shaking you out in a range. You can add “after the crossover, Aroon Up must stay above 70 for 5 full bars”, or pair it with ADX, which measures trend strength (for how ADX behaves, see What is the ADX indicator?).
All three examples have to accept the same thing: Aroon only counts days. It tells you “the new high is fresh”, not “whether this new high means anything”. It works better as a timer for “is the trend still there?” than as a buy-or-sell button.
Common mistakes
1. Chasing as soon as Aroon Up hits 100
A reading of 100 shows up often in ranges too. In the stretch at 1 on the chart, 84 candles whose first and last prices were only 0.4% apart, Aroon Up still hit 100 4 times, and one of those new highs was only 0.11% higher.
2. Reading the straight-line slide as growing selling pressure
After a high, Aroon Up losing 4 points a day is simply the shape of the formula. In the 20 days at 4 on the chart, the price went both down and up, yet Aroon Up kept sliding all the way. It reflects “how long since the last new high”, not “more and more people are selling”.
3. Using Aroon to judge how far the price has risen
There is no price in the formula. A new high 0.11% higher and one 10% higher both give an Aroon Up of 100. To know how far and how fast the price has risen, look at indicators based on price, such as ROC (see What is ROC (Rate of Change)?).
FAQ
What is the Aroon indicator?
Aroon is a trend indicator introduced by Tushar Chande. It judges how fresh a trend is by “how many bars have passed since the most recent new high or new low”. Aroon Up and Aroon Down both range from 0 to 100, and the usual period is 25.
How do you read Aroon?
A common reading is that Aroon Up above 70 with Aroon Down below 30 leans bullish, and the reverse leans bearish; when the two lines cross, the fresher side has changed hands. Crossovers are very frequent in ranges, so it is best paired with other trend conditions.
How is Aroon different from ADX?
ADX measures the strength of a trend: how hard the price is pushing in one direction. Aroon measures time: how long since the last new high or new low. One looks at effort, the other at the calendar, and they complement each other.
Does MT5 have Aroon?
MT5 has no built-in Aroon; you need to install a custom indicator separately. Different platforms may default to a period of 25 or 14, so check that the settings match before comparing values.
Conclusion
Aroon is simple: it only counts days. That makes it very precise about “is the trend still fresh?”, and it says not a word about “how strong is the trend?”
So the real question is: once you add “Aroon Up above 70” to your entry rules, are the false signals it removes in ranges worth the extra days you wait? One stretch of historical prices cannot answer that; you have to backtest the rule over many stretches of the market.
Don’t have rules of your own yet, and don’t want to piece them together one indicator at a time? With MASQuant’s Strategy Genie, you just choose an investment style first; the AI analyses market conditions, selects instruments and gives you three candidate strategies at once. Each one has already been backtested on historical data, with its returns and maximum drawdown laid out in the open, and then you decide whether to deploy it to MT5.
If you already have an idea of your own, write the condition as one sentence, for example “only go long when Aroon Up is above 70 and Aroon Down is below 30”, give it to the AI Strategy Assistant, and press go to start the backtest. The backtest environment includes real market frictions such as spreads, slippage, changes in market liquidity and execution delays (see the AI Strategy Assistant guide for how to use it). Then remove the Aroon condition and run it again, and you will see how much it helped. A backtest tells you “how this rule performed in past market conditions”, not a guarantee about the future.
An idea only becomes a strategy once it’s been tested.
The price chart in this article is taken from historical prices on the MT5 platform (daily; quotes and daily candle cut-off times differ slightly between platforms, so values may not match exactly), and the indicators are calculated by a program using the standard formulas; the round numbers in the example are not market data. Historical prices are used only to show how the indicator behaves and do not represent future price movements.
Risk disclosure: CFDs are high-risk financial products and can lead to rapid loss of capital. Past performance does not guarantee future results. All strategies and backtests are for reference only and do not constitute investment advice. Please read our Risk Disclosure carefully before trading.


