
What Is the ADX Indicator? Should You Go Long When ADX Is High? It Measures Strength, Not Direction
“ADX has shot up to 40, the trend is strong, so it’s time to go long, right?”
That sentence goes wrong in one place: ADX only measures how strong a trend is, not which way it is going. A big rally pushes ADX up, and so does a big sell-off. This article first works through three sets of numbers, where you will see a rally and a sell-off produce exactly the same figure; then it uses a real chart marked 1 to 5 (EUR/USD, 2017–2018) to show why ADX is always a step behind.
This article is part of MASQuant’s “Trading Academy · Technical Indicators” series. All the indicators are sorted by category in Technical Indicators: The Complete Guide.
In one sentence
ADX = a “strength gauge” for trends: the higher the number, the more the recent price action looks like a trend.
The question it answers: “Is there a trend right now, or is the market moving sideways?” It does not answer “up or down”.
ADX is like a car’s speedometer: it tells you how fast you are going, not whether you are heading north or south. Drive north at 80 and it shows 80; drive south at 80 and it still shows 80. For direction you need the other two lines, +DI and −DI: they are the compass.
Work it out once: rally or sell-off, same number
ADX is made up of three lines. In plain words first:
- +DI: over the recent period, how strongly the price has pushed above the previous candle’s high.
- −DI: over the recent period, how strongly the price has pushed below the previous candle’s low.
- ADX: how far apart +DI and −DI are.
Step one: for each candle, look at “how much further it went up, and how much further it went down” (the following are round numbers made up for the example, not market data). Today’s high is 105 and yesterday’s high was 102, so it went 3 further up; today’s low is 99 and yesterday’s low was 100, so it went 1 further down. The upward move is bigger, so this candle is recorded as “up 3, down 0”. Record the last 14 candles this way and average them, and you get +DI and −DI.
Step two: look at how far apart +DI and −DI are. This number is called DX:
| Situation | +DI | −DI | DX = difference ÷ sum × 100 |
|---|---|---|---|
| A clear rally | 30 | 10 | 20 ÷ 40 × 100 = 50 |
| A clear sell-off | 10 | 30 | 20 ÷ 40 × 100 = 50 |
| Sideways, both about even | 22 | 18 | 4 ÷ 40 × 100 = 10 |
This is the key: the “difference” is taken as an absolute value, no matter which one is bigger. A rally and a sell-off both come out at 50; only a sideways market where the two sides are evenly matched gives a low number.
Step three: ADX is DX smoothed once more (“smoothing” here means averaging the last 14 numbers so the line does not jump around). +DI and −DI have already been smoothed once, and ADX is smoothed again. Smoothed twice, so ADX is slow.
The formula
The usual setting is 14:
1 For each candle:
   +DM = today's high − yesterday's high (counts only if larger than the downward move and above 0; otherwise 0)
   −DM = yesterday's low − today's low (counts only if larger than the upward move and above 0; otherwise 0)
   TR  = true range (calculated as for ATR)

2 Smooth +DM, −DM and TR over 14 periods each:
   +DI = smoothed +DM ÷ smoothed TR × 100
   −DI = smoothed −DM ÷ smoothed TR × 100

3 DX  = |+DI − −DI| ÷ (+DI + −DI) × 100
   ADX = DX smoothed over 14 periods
ADX was introduced by J. Welles Wilder Jr. in 1978, in the same book as RSI and ATR. A common reading is that ADX below 20 leans towards a sideways market and above 25 leans towards a trend. These are just customary reference lines, not hard boundaries.
MT5 has two ADX indicators: Average Directional Movement Index and ADX Wilder. The latter uses Wilder’s original smoothing, and it is the one used for the chart in this article; the former uses a different smoothing, so the two plot different values. Before comparing values across platforms, check which one is being used.
Read the chart: the euro in 2017–2018, following 1 to 5
The chart below shows EUR/USD (EURUSD) on the daily timeframe from August 2017 to May 2018, taken from MT5’s historical prices. It went through a range, a rally, a range and a sell-off in turn: from November 2017 to January 2018 it rose from 1.158 to 1.241, and from April to May 2018 it fell from 1.230 to 1.169.
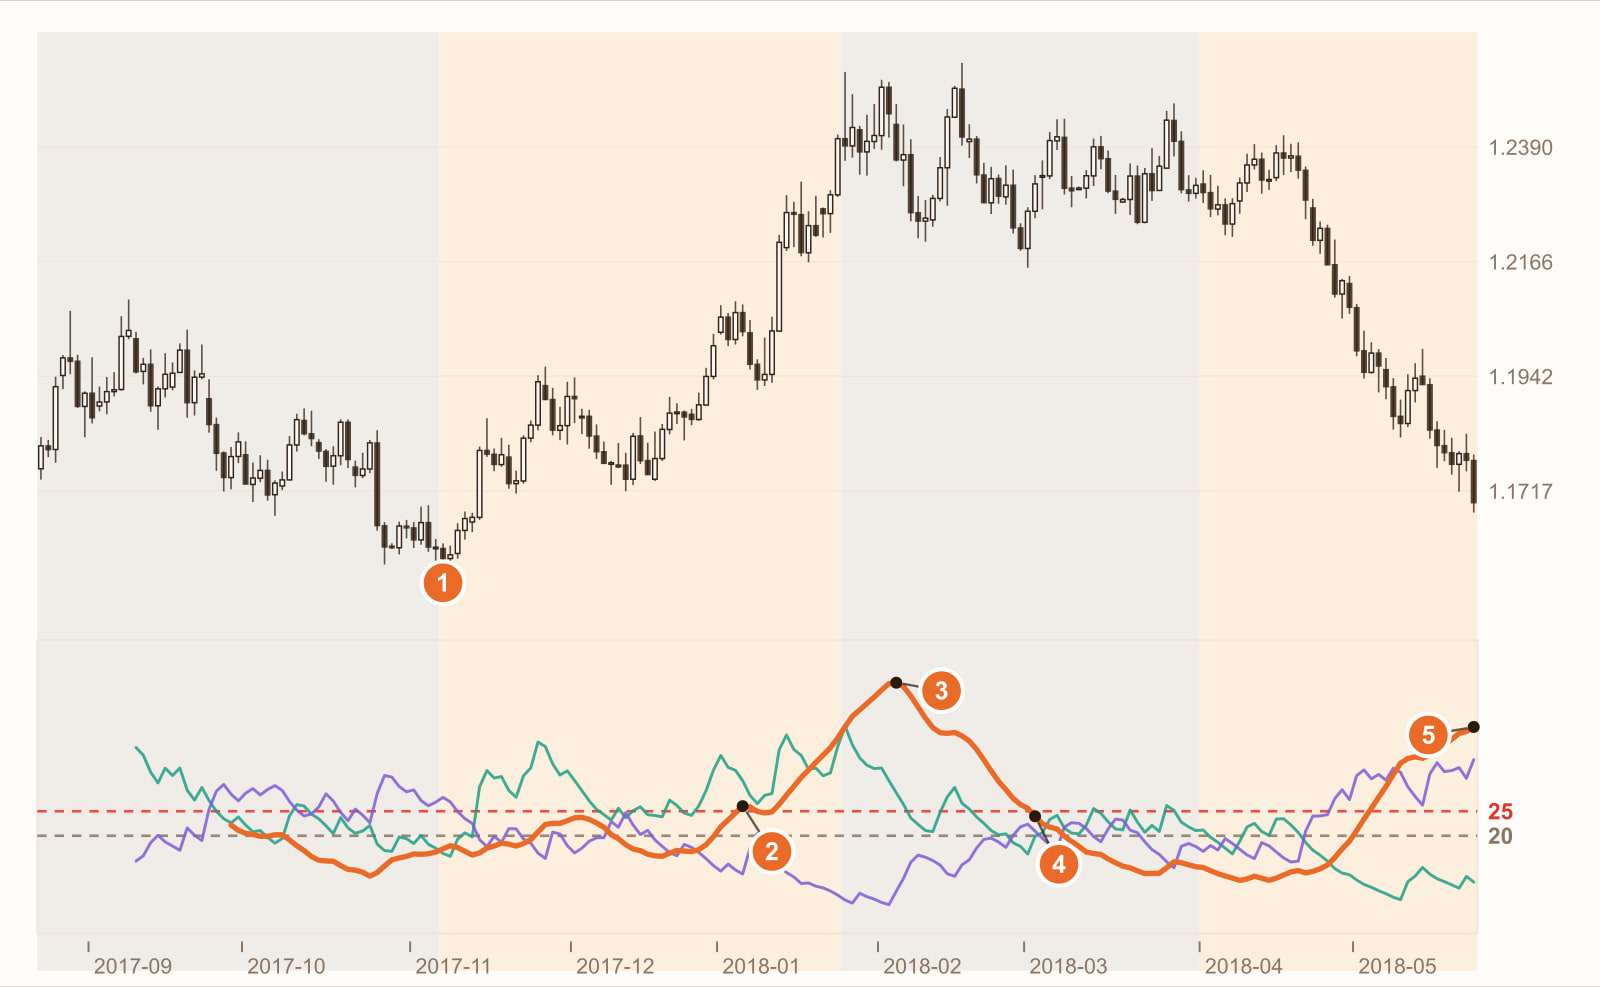
The rally begins (7 November 2017). The price leaves the range and heads up. At this point ADX is 17.3 and has not reacted yet.
ADX rises above 25: the 41st bar after the rally began (5 January 2018). The whole rally lasted only 55 bars, so by the time ADX confirmed “there is a trend”, most of the move was already done. The direction was actually written in the DI lines much earlier: during the rally, +DI (green) stayed above −DI (purple) for up to 29 bars in a row.
ADX peaks at 51.3: the rally had already ended 8 bars earlier (5 February 2018). The price had already moved into a range, yet ADX was still climbing. That is the cost of smoothing twice: it tells you “whether the past stretch as a whole looked like a trend”, not “this candle right now”.
ADX only falls back below 25: the 26th bar after the range began (2 March). The range had been going for 26 bars before ADX admitted “the trend is gone”. Over the last 30 bars of the two ranges, ADX averaged 16 and 19.4 respectively, back to range levels.
During the sell-off, ADX rises to 42.2 and is still rising. Just like 3, this is a high level. From ADX alone, you cannot tell which stretch was rising and which was falling. Direction comes from the DI lines: during the sell-off, −DI stayed above +DI for up to 24 bars in a row. When the sell-off began, ADX was only 13.5, and once again it took 23 bars to rise above 25.
This is a real stretch of historical prices, used to show how ADX behaves. It is not a general rule. Change the instrument, the timeframe or the period, and every number will change.
What you see, what it means
| What you see | What it usually means | But be careful |
|---|---|---|
| ADX below 20 and flat | A sideways market with no clear trend | Trend-following methods (moving averages, breakouts) get shaken out most easily here |
| ADX climbs from low levels above 25 | A trend is forming | By the time it crosses 25, the price has usually already moved a fair way (like 2 on the chart) |
| ADX is very high, say above 40 | The trend is very strong | It does not mean the market is rising; a big sell-off reads just as high (3 and 5 on the chart) |
| ADX falls from a peak | The trend is slowing | Not necessarily a reversal; it may just be a pause |
| +DI above −DI | Leaning bullish | When ADX is very low, which DI is on top means little |
| −DI above +DI | Leaning bearish | Same as above |
How to use it: three examples
Example 1: as a “market-condition filter”
This is the most common way to use ADX. The rule can be written as: “Only use moving-average or breakout entries when ADX is above 25; when ADX is below 20, take no trend-following trades.” ADX does not decide whether to buy or sell; it only decides “whether trend-following methods suit the market right now”.
Example 2: leave direction to the DI lines
Once ADX says “there is a trend”, the DI lines tell you which way to trade: go long only when +DI is above −DI, and short only in the opposite case. For example: “Go long only when ADX is above 25 and +DI is above −DI.”
Example 3: keep always-flipping indicators out of ranges
Indicators like the Parabolic SAR, which are “always in the market and flip whenever touched”, get shaken out again and again in a range. Adding “ignore flips while ADX is below 20” can cut out a lot of back-and-forth. For how SAR behaves, see What is the Parabolic SAR?
All three examples have to accept the same thing: ADX is slow. Wait for it to rise above 25 before entering and the trend has often already run a while; wait for it to fall before exiting and you have often already given back a fair amount. It works better as a background weather forecast than as an alarm clock for entries and exits.
Common mistakes
1. Going long because ADX is high
On the chart, the rally pushed ADX to 51.3 and the sell-off pushed it to 42.2 and still rising: both are high readings. A high ADX only means “there is a trend”, and that could be a big rally or a big sell-off.
2. Assuming the trend is over when ADX falls from a peak
A falling ADX only means the gap between +DI and −DI is narrowing. The trend may be resting or slowing down, not necessarily reversing; the price may still be drifting in the same direction.
3. Treating 25 as a hard line
20, 25 and 30 are all just common reference lines. ADX levels differ between instruments and timeframes, and applying one fixed line to everything easily misfires.
FAQ
What is the ADX indicator?
ADX (Average Directional Index) is a trend-strength indicator introduced by Wilder. Its value ranges from 0 to 100, and the usual setting is 14. It measures how strong the recent trend is, regardless of whether prices are rising or falling; for direction it has to be read together with +DI and −DI.
What ADX level counts as a trend?
A common reading is that above 25 leans towards a trend and below 20 leans towards a sideways market. These are only reference lines; levels vary between instruments, so it is best to observe or backtest on your own instrument.
Can ADX tell whether the market is going up or down?
No. ADX rises in both rallies and sell-offs: +DI 30 with −DI 10 and +DI 10 with −DI 30 both give a DX of 50. To judge direction, look at whether +DI or −DI is on top.
How are ADX and DMI related?
DMI (Directional Movement Index) refers to the pair of lines +DI and −DI, and ADX is calculated from them. Many charting platforms put all three lines in a single indicator.
Conclusion
ADX is honest: it tells you “whether there is a trend right now”, and it is usually right, it just says so late. It never tells you which way the market is heading; that is the job of +DI and −DI.
So the real question is: once you add an ADX filter to your trend-following strategy, are the false signals it removes worth those few bars of delay? One stretch of historical prices cannot answer that. Backtest it with our AI Strategy Assistant and you will know.
Write the condition as one sentence, for example “go long only when ADX is above 25 and +DI is above −DI”, give it to MASQuant’s AI Strategy Assistant, and press go to start the backtest. The backtest environment includes real market frictions such as spreads, slippage, changes in market liquidity and execution delays (see the AI Strategy Assistant guide for how to use it). Then remove the ADX condition and run it again, and you will see how much the filter actually helped. A backtest tells you “how this rule performed in past market conditions”, not a guarantee about the future.
An idea only becomes a strategy once it’s been tested.
The price chart in this article is taken from historical prices on the MT5 platform (daily; quotes and daily candle cut-off times differ slightly between platforms, so values may not match exactly), and the indicators are calculated by a program using the standard formulas; the round numbers in the example are not market data. Historical prices are used only to show how the indicator behaves and do not represent future price movements.
Risk disclosure: CFDs are high-risk financial products and can lead to rapid loss of capital. Past performance does not guarantee future results. All strategies and backtests are for reference only and do not constitute investment advice. Please read our Risk Disclosure carefully before trading.
Further reading:


