
What Is the OBV Indicator? If OBV Keeps Rising, Is Someone Accumulating?
“The price has barely moved, yet OBV keeps climbing. Is someone quietly accumulating?”
That is the most common way to use OBV: to see whether “volume” moves before “price”. The idea makes sense, but OBV has two features few people talk about: a single volume spike can rewrite the whole line, and on CFDs, the “volume” it looks at is usually not the volume you think it is. This article first works through 5 candles, then uses a real chart marked 1 to 4 (EUR/USD, 2024) to make both points clear.
This article is part of MASQuant’s “Trading Academy · Technical Indicators” series. All the indicators are sorted by category in Technical Indicators: The Complete Guide.
In one sentence
OBV (On-Balance Volume) = if the close is up, add this candle’s volume; if the close is down, subtract it; keep adding it all up into one line.
The question it answers: “Has recent volume shown up more on rising candles or on falling candles?”
Think of it as a very rough ledger: the volume of every candle that closes up is booked in full as “income”, and the volume of every candle that closes down is booked in full as “expenses”. The problem is that it does not care how much the price rose or fell: rise by a single cent and the candle’s entire volume is still booked as income.
Work it out once: 5 candles are enough
Below are the closing prices and volumes of 5 candles (these are numbers made up for the example, not market data), with the ledger starting from candle 1:
| Candle | Close | Versus previous | Volume | How OBV changes | OBV |
|---|---|---|---|---|---|
| Candle 1 | 100.0 | — | — | Start counting here | 0 |
| Candle 2 | 100.5 | Up | 300 | +300 | 300 |
| Candle 3 | 100.2 | Down | 200 | −200 | 100 |
| Candle 4 | 100.3 | Up only 0.1 | 2,000 | +2,000 | 2,100 |
| Candle 5 | 100.1 | Down | 250 | −250 | 1,850 |
From candle 1 to candle 5, the price goes from 100.0 to 100.1, barely moving at all; yet OBV rises from 0 to 1,850. And almost all of that 1,850 comes from candle 4: its volume was unusually large and it happened to close 0.1 above the previous candle, so the full 2,000 was added.
Looking only at the OBV line, you would think “the price hasn’t moved but volume keeps coming in, someone is accumulating”. In reality, one volume spike just happened to close a fraction higher.
Note also that OBV is accumulated from some starting candle. Start counting from candle 3 and the numbers are completely different. So the OBV number itself (say, “OBV is 1,850”) means nothing; only the direction it is moving in means anything.
The formula
Close higher than previous: OBV = previous OBV + this candle's volume
Close lower than previous:  OBV = previous OBV − this candle's volume
Close unchanged:            OBV stays the same
OBV (On-Balance Volume) was introduced by Joseph Granville in 1963. In MT5 it is the built-in On Balance Volume, which by default uses tick volume (explained below).
Read the chart: the candle of 5 August 2024, following 1 to 4
The chart below shows EUR/USD (EURUSD) on the daily timeframe from March to August 2024, taken from MT5’s historical prices. We only calculate the grey-shaded stretch: 10 June to 9 August, 45 candles in all, during which the price went from 1.0800 to 1.0914, a change of only 1.1%. The last few days of this stretch happened to include 5 August 2024, the day global stock markets plunged.
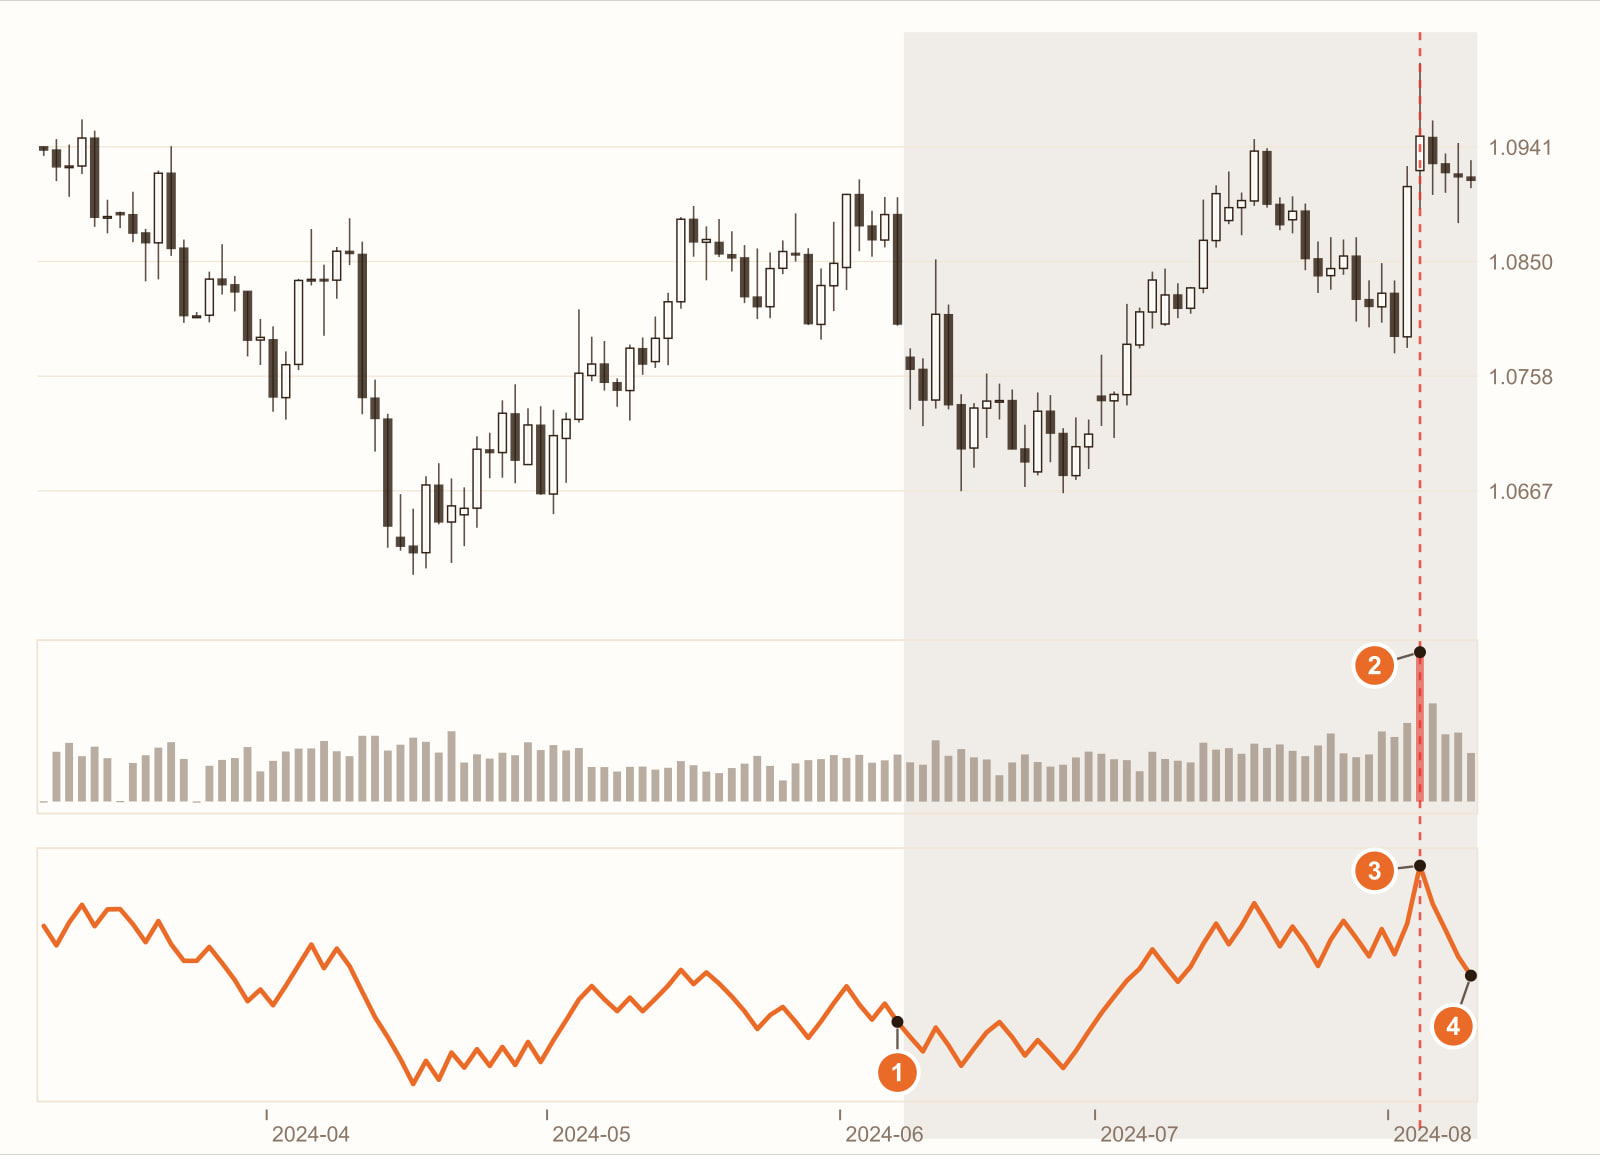
Start counting here (OBV at the close of 7 June).
The candle of 5 August had 3.2 times the chart’s average volume. Global stock markets plunged that day and price ticks surged; and its close happened to be 0.4% above the previous day’s.
So that candle’s entire volume was added, and OBV jumped a big step in one go. Just like candle 4 in the example above.
9 August: the stretch ends. From 1 to 4, OBV rose by about 153,000; but the candle at 2 alone added about 192,000, more than the rise over the whole stretch. Take it out, and OBV over these two months actually fell by about 39,000.
Looking only at the OBV line, you would think “the price has hardly moved and volume keeps coming in”; in reality, one volume spike that happened to close a little higher turned two months of OBV positive. (The “volume” here is tick volume, measured in the number of price changes.)
This is a real stretch of historical prices, used to show how OBV behaves. It is not a general rule. Change the instrument, the timeframe or the period, and every number will change.
On CFDs, what is OBV’s “volume”?
This point matters especially for CFD traders. Stocks and futures have trading volume published by an exchange; CFDs mostly have no central exchange, so what is usually available in MT5 is tick volume: the number of times the price quote changed during the period, not how many contracts actually traded.
MT5’s built-in On Balance Volume uses tick volume by default. Tick volume is often used as a proxy for how active trading is, but it reflects the number of quote changes, is affected by volatility, the quote source and the trading session, and is not the same thing as real trading volume. The same instrument may also show a different-looking OBV on different platforms and with different quote sources.
What you see, what it means
| What you see | What it usually means | But be careful |
|---|---|---|
| OBV and price rise together | Volume is larger on rising candles; volume and price are in sync | The OBV number itself means nothing; look only at direction |
| Price flat, OBV rising | Some call this “volume leading price” | First check whether it is being propped up by one or two volume spikes (1 to 4 on the chart) |
| Price makes a new high, OBV does not | Volume-price divergence; momentum may be fading | It may also just be that an earlier volume spike lifted OBV too high |
| OBV suddenly jumps a big step | One candle had unusually high volume | Usually linked to news or an event, not necessarily sustained buying |
How to use it: three examples
Example 1: look at direction, not numbers
The questions are “are OBV and price moving the same way?” and “has OBV made a new high or low?”, not “what is OBV now?”. The number depends on where you started counting and cannot be compared.
Example 2: first check which candles drove it
When you see a clear rise in OBV, look down at the volume: did it come in steadily, or was it propped up by one or two spikes? The latter, like 2 on the chart, is usually linked to some piece of news and does not necessarily mean sustained buying.
Example 3: use it as “confirmation”, not as a “signal”
For example: when the price closes above the 20-day line, it only counts if OBV is also above its own 20-day average. OBV is not there to tell you when to enter; it is only there for a second look at “whether volume is keeping up”.
Common mistakes
1. Comparing OBV numbers at two points in time
“Last month OBV was 5,000, now it is 8,000”: this comparison only holds from the same starting point and on the same platform, and even then you still need to check whether a few volume spikes dominated in between.
2. Treating OBV divergence as a reversal signal
When the price makes a new high and OBV does not, it is often called volume-price divergence. It may be a warning, or it may just be that an earlier volume spike lifted OBV too high. A divergence is a clue, not a verdict; see Does MACD divergence always mean a reversal?
3. Treating it as real trading volume on CFDs
Tick volume is not trading volume. OBV calculated from tick volume can only serve as a reference at best.
FAQ
What is the OBV indicator?
OBV (On-Balance Volume) was introduced by Joseph Granville in 1963. It adds the candle’s volume when the close is up and subtracts it when the close is down, accumulating into one line, which is used to see whether volume and price are moving in the same direction.
What does a high OBV value mean?
The value on its own means nothing, because it depends on where the accumulation started. What matters is OBV’s direction and whether it moves in line with price.
What is OBV divergence?
When the price makes a new high and OBV does not (or the other way round), it is called volume-price divergence and is often seen as a clue that momentum is weakening. But one or two volume spikes can create a false divergence, so it cannot be used as a reversal signal on its own.
Can OBV be used on CFDs?
Yes, but be aware that CFDs on MT5 mostly have only tick volume, and OBV is calculated from tick volume by default. It reflects how active price quotes are, not how many contracts actually traded.
Conclusion
The idea behind OBV is good: volume often reveals strength a step before price does. But its calculation is crude: it only looks at whether the close is up or down, and adds or subtracts the candle’s entire volume. A single volume spike is enough to prop up a whole stretch of OBV.
So the real question is: on your instrument, do OBV’s turns lead the price, or does OBV just follow it? One stretch of historical prices cannot answer that. Backtest it with our AI Strategy Assistant and you will know.
Write the condition as one sentence, for example “enter only when OBV is above its own 20-day average and the price is above the 20-day line”, give it to MASQuant’s AI Strategy Assistant, and press go to start the backtest. The backtest environment includes real market frictions such as spreads, slippage, changes in market liquidity and execution delays (see the AI Strategy Assistant guide for how to use it). Then remove the OBV condition and run it again, and you will see whether it actually helped. A backtest tells you “how this rule performed in past market conditions”, not a guarantee about the future.
An idea only becomes a strategy once it’s been tested.
The price chart in this article is taken from historical prices on the MT5 platform (daily; quotes and daily candle cut-off times differ slightly between platforms, so values may not match exactly), and the indicators are calculated by a program using the standard formulas; the round numbers in the example are not market data. Historical prices are used only to show how the indicator behaves and do not represent future price movements.
Risk disclosure: CFDs are high-risk financial products and can lead to rapid loss of capital. Past performance does not guarantee future results. All strategies and backtests are for reference only and do not constitute investment advice. Please read our Risk Disclosure carefully before trading.



Comment
What Is the A/D Indicator? Accumulation/Distribution Formula, CLV Worked Example, and How It Differs from OBV
October 27, 2026[…] What Is the OBV Indicator? If OBV Keeps Rising, Is Someone Accumulating? […]