
What Is the Parabolic SAR? Smooth in a Trend, Shaken Out Again and Again in a Range
“The SAR has flipped below the price, go long.”
The Parabolic SAR is one of the easiest indicators to understand: a string of dots, bullish when they are below the price and bearish when they are above it. The name SAR stands for Stop And Reverse: it is always in the market, and it flips sides the moment it is touched. This article first works through two candles to show how it “closes in faster the longer it chases”, then uses a real chart marked 1 to 4 (gold, 2024) to show its two fates, in a trend and in a range.
This article is part of MASQuant’s “Trading Academy · Technical Indicators” series. All the indicators are sorted by category in Technical Indicators: The Complete Guide.
In one sentence
Parabolic SAR = a stop-loss line that tightens upward (or downward) on its own; when it is touched, you stop out and reverse at the same time.
The question it answers: “If I hold with the trend right now, where should my stop loss be?”
Think of it like this: after going long, you tie a rope below the price as your stop loss. Every time the price makes a new high, you pull the rope up a little, and the more new highs there are, the faster you pull it in. The moment the rope is touched, you stop out and at the same time go short, re-tying the rope above the price and pulling it down from above.
Work it out once: two candles are enough
Taking a long position as the example, the SAR moves a little closer each bar to “the highest price since this long trade began”, and how much closer is set by the acceleration factor (AF) (the following are numbers made up for the example, not market data):
| When | Situation | Calculation | Next bar’s SAR |
|---|---|---|---|
| Bar 1 | Long: SAR 100, highest price so far 110, AF 0.02 | 100 + 0.02 × (110 − 100) | 100.2 |
| Bar 2 | Price makes a new high of 112: the highest price becomes 112, AF rises to 0.04 | 100.2 + 0.04 × (112 − 100.2) | about 100.67 |
| After that | Each new high adds another 0.02 to AF, up to a maximum of 0.2 | Each bar closes a growing share of the gap to the highest price | It chases faster and faster |
| When touched | A bar’s low breaks below the SAR | It flips to short | The SAR jumps to the highest price of the move and starts chasing down from above |
On bar 1 it only moves up 0.2; on bar 2 it moves nearly 0.47. The more new highs there are, the faster the SAR chases, and what you get on the chart is an upward-curving parabola, which is where the name comes from.
This design works well in a trend: the stop follows the price automatically, so you do not have to judge it yourself. But it also has a trait it cannot escape: it has no “out of the market” option. It is always either long or short, even in a range.
The formula
Next bar's SAR = this bar's SAR + AF × (EP − this bar's SAR)
EP (extreme point): the highest price since the long move began (the lowest price when short)
AF (acceleration factor): starts at 0.02, adds 0.02 with each new high (new low when short), up to a maximum of 0.2
The Parabolic SAR was introduced by J. Welles Wilder Jr. in 1978, in the same book as RSI, ATR and ADX. In MT5 it is the built-in Parabolic SAR, with a default acceleration factor of 0.02 and a maximum of 0.2.
Read the chart: gold in spring 2024, following 1 to 4
The chart below shows gold (XAUUSD) on the daily timeframe from November 2023 to June 2024, taken from MT5’s historical prices. Until February 2024, gold moved sideways with closes between 1,938 and 2,077; from late February to mid-April it rallied 18%, then moved back and forth near the highs.
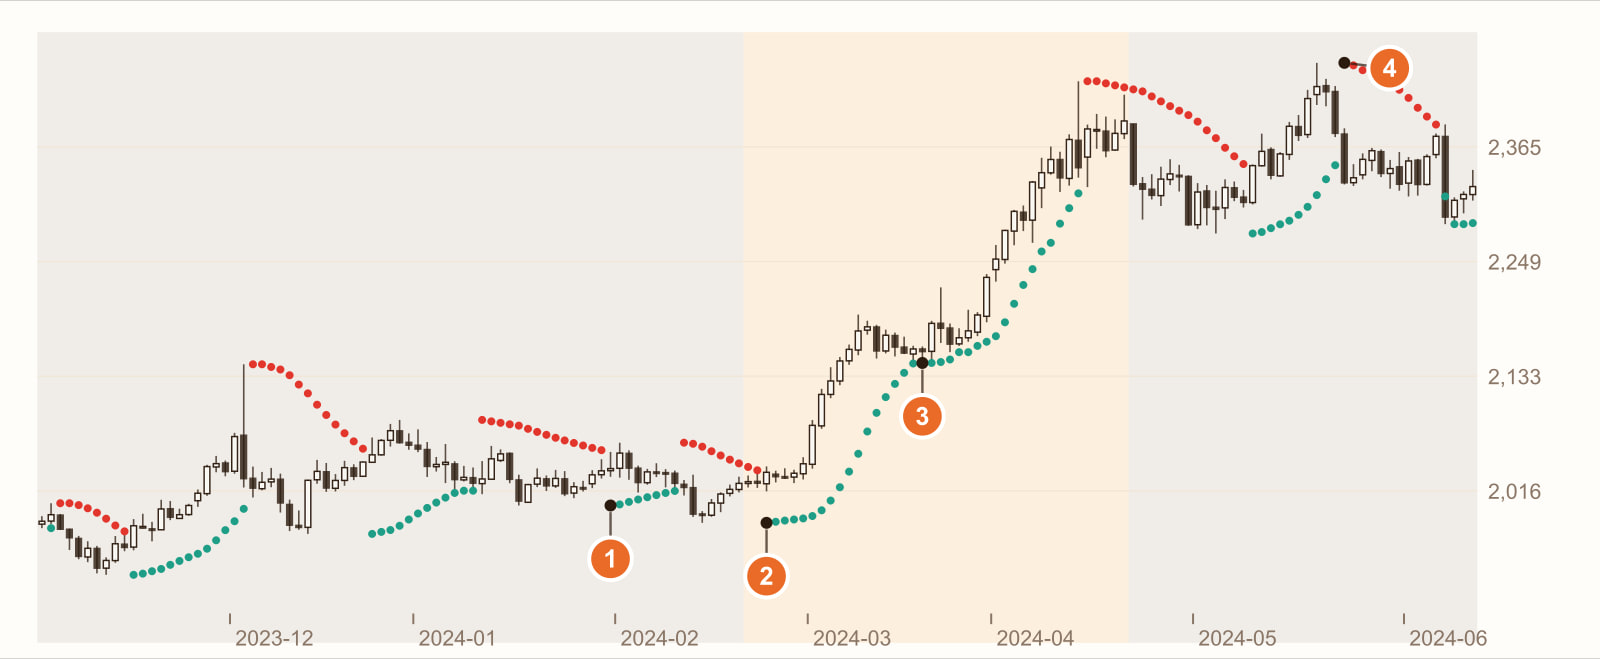
In the range: green one moment, red the next (31 January 2024). In the nearly four-month range at the start, the SAR flipped 7 times, switching sides about every 11 bars on average. Each flip, by the rules, means a stop-out plus a reverse entry; trading in and out in a directionless market mostly means paying spreads and small stop losses.
As the rally begins, it flips back below the price (23 February).
Holding all the way (19 March). From 2 onwards, the SAR stayed below the price for up to 35 bars in a row, tightening bar by bar. The whole rally (light orange shading, 21 February to 19 April) gained 18% with only 2 flips. The SAR acts like a stop that tightens upward on its own, so you do not have to decide for yourself when to leave.
It flips short on the 3rd bar after the top (23 May). The highest close was 2,426 on 20 May; only 3 bars later, the SAR was touched and flipped above. The upside of trailing tightly is getting out early when the trend turns. But in the second range on the right, the SAR flipped 3 times, counting 4.
This is a real stretch of historical prices, used to show how the SAR behaves. It is not a general rule. Change the instrument, the timeframe or the period, and every number will change.
What you see, what it means
| What you see | What it usually means | But be careful |
|---|---|---|
| Dots below the price, tightening upward | A rally, with the stop following it up (3 on the chart) | It does not tell you how far the rally will go |
| Dots flip from below to above | The price broke the stop line and turned bearish | In a range it often flips and then flips straight back (1 on the chart) |
| Dots closing in on the price quickly | Many new highs have been made, so AF has grown | Even a small pullback may touch it |
| Dots flipping back and forth above and below the price | A directionless range | Trading every flip means paying spreads and small stop losses over and over |
How to use it: three examples
Example 1: use it only for exits
Many traders do not use the SAR to enter, only as a trailing stop: entries are left to other conditions, while holding and exiting are left to the SAR. This cuts out repeated entries in ranges while keeping its trend advantage of “following the price up automatically” (34 on the chart).
Example 2: add a market-condition filter
The SAR itself cannot tell a range from a trend; it just keeps flipping. A common approach is to pair it with a tool that judges the market condition, such as ADX: when ADX is below 20, ignore SAR flips. For how to read ADX, see What is the ADX indicator?
Example 3: loosen or tighten it
The larger the AF starting value and cap, the more tightly the SAR trails, the earlier you exit, and the more easily normal pullbacks knock you out; the smaller they are, the looser it is and the later you exit. 0.02 and 0.2 are Wilder’s original settings and do not necessarily suit every instrument and timeframe. If you want a trailing stop with “a steady, looser distance”, see What is Supertrend?
Common mistakes
1. Entering in the opposite direction at every flip
That is how the SAR was originally designed, but in a range it is costly. The range on the left of the chart meant 7 round trips.
2. Using it as is on instruments that gap a lot
The SAR moves towards the price bar by bar; when the price gaps, it can jump well past the SAR in one go, and the actual exit price can be much worse than the SAR level.
3. Treating the SAR dot as an exact stop price
The SAR gives a theoretical level. Actual fills are affected by spreads, slippage and gaps, especially on CFDs, which have spreads. For the effect of spreads, see What is the spread?
FAQ
What is the Parabolic SAR?
The Parabolic SAR (stop and reverse) was introduced by Wilder in 1978. It plots dots below or above the price, representing the stop-loss level for a long or short position. When the price touches the SAR, it flips direction, so it is always in the market.
What is the SAR’s acceleration factor?
The acceleration factor (AF) sets what share of the gap to the highest price (the lowest price when short) the SAR closes each bar. The common setting starts at 0.02, adds 0.02 with each new high, and caps at 0.2. For example, with a SAR of 100, a highest price of 110 and an AF of 0.02, the next bar’s SAR is 100.2.
What kind of market suits the Parabolic SAR?
Markets with a clear trend. In a range, the SAR flips repeatedly and generates many back-and-forth stop-out signals.
How is the SAR different from Supertrend?
Both are trailing stops that flip sides. The SAR tightens faster and faster using the acceleration factor; Supertrend keeps its distance from the price using ATR, usually flips less often, but also exits later. See What is Supertrend? for details.
Conclusion
The SAR’s smoothness is real: in a trend it lets you hold all the way, for up to 35 bars without touching anything. Its exhausting side is real too: in a range it switches sides about every 11 bars on average. Both come from the same design: always being in the market.
So the real question is: on your instrument, do the stretches you manage to hold in a trend pay for all the small back-and-forth stop losses in ranges? One stretch of historical prices cannot answer that. Backtest it with our AI Strategy Assistant and you will know.
Write the condition as one sentence, for example “go long when the SAR flips below the price, exit when it flips above”, give it to MASQuant’s AI Strategy Assistant, and press go to start the backtest. The backtest environment includes real market frictions such as spreads, slippage, changes in market liquidity and execution delays (see the AI Strategy Assistant guide for how to use it). Then add “only enter when ADX is above 25”, run it again and compare the difference. A backtest tells you “how this rule performed in past market conditions”, not a guarantee about the future.
An idea only becomes a strategy once it’s been tested.
The price chart in this article is taken from historical prices on the MT5 platform (daily; quotes and daily candle cut-off times differ slightly between platforms, so values may not match exactly), and the indicators are calculated by a program using the standard formulas; the round numbers in the example are not market data. Historical prices are used only to show how the indicator behaves and do not represent future price movements.
Risk disclosure: CFDs are high-risk financial products and can lead to rapid loss of capital. Past performance does not guarantee future results. All strategies and backtests are for reference only and do not constitute investment advice. Please read our Risk Disclosure carefully before trading.


