
What Is the Keltner Channel? How It Differs from Bollinger Bands, and What a “Squeeze” Really Is
“Isn’t this just Bollinger Bands?”
At first glance, the Keltner Channel does look like Bollinger Bands: a midline, one band above and one below, with the price moving inside. But they measure width differently: Bollinger Bands use standard deviation, the Keltner Channel uses ATR. That difference makes them react very differently when “the market goes quiet” and when “the market suddenly starts moving”. This article first works it out once with two sets of numbers, then lays both channels over the same stretch on a real chart marked 1 to 4 (gold, 2025).
This article is part of MASQuant’s “Trading Academy · Technical Indicators” series. All the indicators are sorted by category in Technical Indicators: The Complete Guide.
In one sentence
Keltner Channel = a channel drawn 2 × ATR above and below a midline; its width follows “how much each candle moves on average”.
The question it answers: “How far is the price from its usual range right now, and how big have recent moves been?”
Both channels measure volatility, but in different ways. Think of walking:
- Pacing back and forth on the spot: each step is a decent size, but you stay in roughly the same place. “How big each step is” (ATR) is not small, but “how spread out your recent positions are” (standard deviation) is very small. → Bollinger is narrower than Keltner.
- Walking steadily forward: each step is the same size, but your positions over the last 20 steps spread further and further apart. ATR barely changes, while standard deviation gets very large. → Bollinger is far wider than Keltner.
That is the biggest difference between the two channels: Keltner’s width is steadier; Bollinger’s width shrinks narrower when things are quiet and opens wider in a trend.
Work it out once: two sets of numbers are enough
Suppose both midlines are at 100 (the following are numbers made up for the example, not market data), and both channels use a multiplier of 2:
| Situation | Keltner (2 × ATR) | Bollinger (2 × standard deviation) | Which is wider |
|---|---|---|---|
| A quiet range: ATR 1.5, standard deviation 1 | Upper band 103, lower band 97 (width 6) | Upper band 102, lower band 98 (width 4) | Bollinger shrinks inside Keltner: a squeeze |
| The market starts moving: ATR 2, standard deviation 4 | Upper band 104, lower band 96 (width 8) | Upper band 108, lower band 92 (width 16) | Bollinger opens twice as wide as Keltner |
From quiet to moving, ATR only goes from 1.5 to 2, while standard deviation goes from 1 to 4. Just like the walking analogy: once you start walking steadily in one direction, your “positions” spread out much faster than your “steps” grow.
A “squeeze” is the state in the first row: the whole of the Bollinger Bands shrinks inside the Keltner Channel, meaning recent volatility is much lower than usual.
The formula
Keltner Channel (common defaults: EMA 20, ATR 10, multiplier 2)
Midline = EMA(20)
Upper band = midline + 2 × ATR(10)
Lower band = midline − 2 × ATR(10)

Bollinger Bands (common defaults: 20, 2)
Midline = SMA(20)
Upper band = midline + 2 × standard deviation of the last 20 closes
Lower band = midline − 2 × standard deviation of the last 20 closes
The original Keltner Channel was the version Chester Keltner introduced in 1960; the common version today is a modified one that uses an EMA as the midline and ATR for the width. The Keltner Channel is not a built-in MT5 indicator; you need to install a custom indicator, whereas Bollinger Bands are built into MT5. Different versions of the Keltner Channel may calculate the midline and width differently, so check before comparing. For how ATR is calculated, see What is the ATR indicator?
Read the chart: gold’s summer 2025 squeeze, following 1 to 4
The chart below shows gold (XAUUSD) on the daily timeframe from April to October 2025, taken from MT5’s historical prices. From June to August, gold closed between 3,274 and 3,433, ranging quietly for nearly three months; at the end of August it started to climb, set new highs all through September, and closed at 4,041 on 8 October.
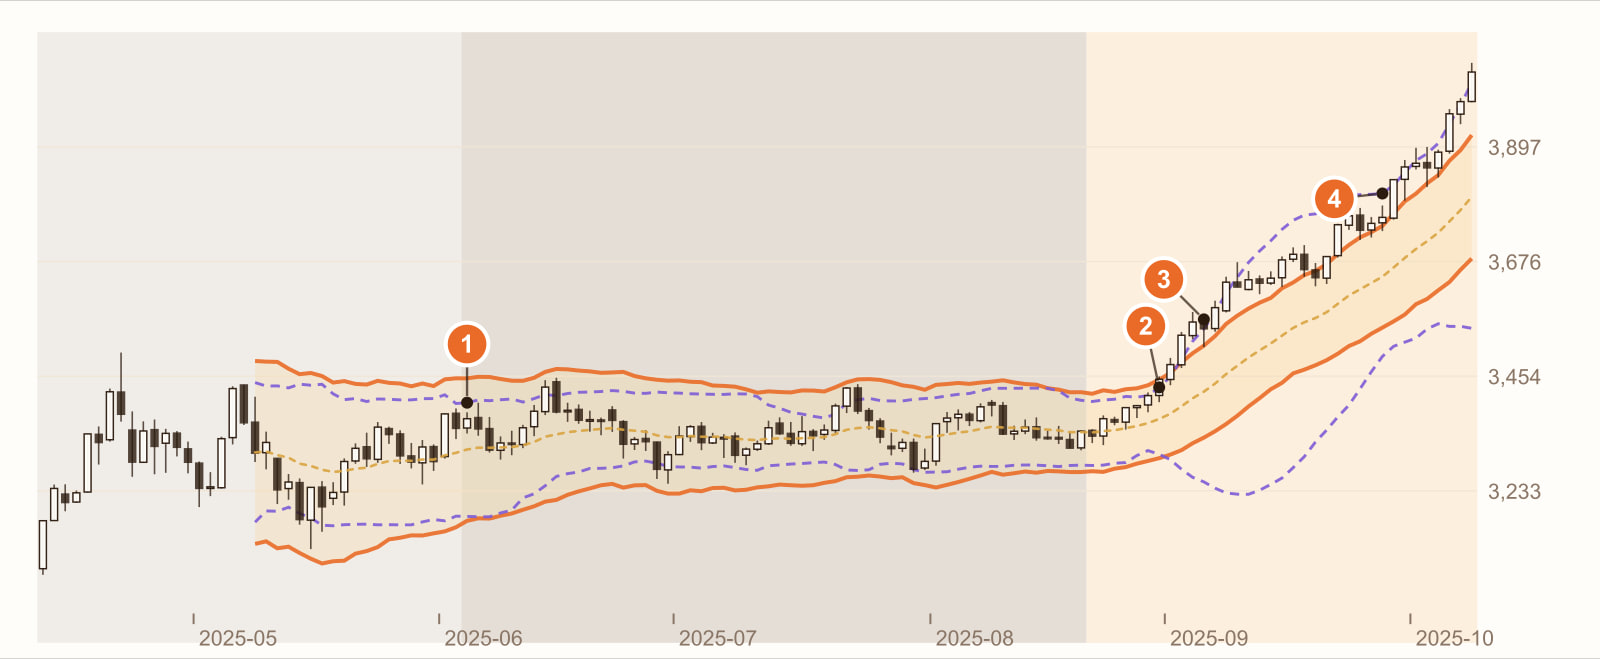
The squeeze begins: Bollinger shrinks inside Keltner (4 June). The price entered a very quiet range in which every candle was small. In this stretch, Bollinger’s width averaged only 0.7 times Keltner’s, and the purple dashed lines sat entirely inside the orange channel.
The squeeze ends: the 6th bar after the rally began (29 August). Bollinger stayed inside Keltner for 63 bars in a row and only opened out here. Over the next 20 bars, the price rose 9.1%.
The price closes outside Keltner’s upper band (4 September). Of the 35 candles in the rally, 28 closed outside the Keltner Channel. The price ran along Keltner’s upper band. That is what strength looks like, not “it touched the upper band, so it has to come back”.
Bollinger opens much wider than Keltner (26 September). During the rally, Bollinger’s width averaged 2 times Keltner’s. In the same stretch, only 11 candles closed outside the Bollinger Bands: Bollinger opened so wide that the price could barely reach its edges.
To be absolutely clear: on this chart, the squeeze happened to be followed by a rally; but a squeeze only tells you that volatility has dropped, not which way the market goes next. The same squeeze followed by a fall, or by more ranging, is just as common.
This is a real stretch of historical prices, used to show how the two channels behave. It is not a general rule. Change the instrument, the timeframe or the period, and every number will change.
What you see, what it means
| What you see | What it usually means | But be careful |
|---|---|---|
| Bollinger shrinks inside Keltner (a squeeze) | Recent volatility is much lower than usual (1 on the chart) | It only says “very quiet”, not which way it goes next |
| Bollinger opens out of Keltner | Volatility is starting to rise (2 on the chart) | The direction depends on which side the price breaks out |
| The price keeps closing outside Keltner’s upper band | A strong rally (3 on the chart) | Not a “sell when it touches the upper band” signal |
| Bollinger much wider than Keltner | The market is moving in one direction and closes are spreading apart (4 on the chart) | Using Bollinger’s upper band as resistance now, the price will rarely reach it |
| The price moving back and forth around Keltner’s midline | No clear direction | The midline is an EMA, so it lags too |
How to use it: three examples
Example 1: use the squeeze to spot when a move is coming
When Bollinger shrinks inside Keltner, don’t rush to act. Wait for it to open out and for the price to break out on one side, then decide on direction. A squeeze only tells you “a move is getting ready”; which way it goes is for the breakout direction or a moving average to decide.
Example 2: use the channel width as a guide for stop-loss distance
Half of Keltner’s width is 2 × ATR. Many traders set stop losses at “a few times ATR” for the same reason Keltner uses it: it reflects how much this instrument normally moves around lately.
Example 3: tell strength from overheating
In a trend, the price can hug Keltner’s upper band or even close outside it (3 on the chart). That is more a description of strength, not necessarily “about to come back”. To judge that it is weakening, you can wait for the price to fall back below the midline instead of acting the moment it touches the upper band.
Common mistakes
1. Treating a squeeze as a buy signal
A squeeze is about low volatility, not direction. This chart happened to go up; another stretch might go down.
2. Selling as soon as it touches the upper band
In the rally on the chart, 28 of the 35 candles closed outside the Keltner Channel. Selling every time it touched the upper band would have had you selling halfway up, all the way up.
3. Thinking Keltner is just a narrower Bollinger
Their widths come from different sources: when it’s quiet, Keltner is wider than Bollinger; in a trend, Keltner is actually narrower than Bollinger. Which one is narrower depends on the market at the time.
FAQ
What is the Keltner Channel?
The Keltner Channel is a channel drawn by adding and subtracting a multiple of volatility to and from a midline. The common version today is EMA(20) plus and minus 2 × ATR(10), used to see the price’s relative position and the size of its moves. For example, with a midline of 100 and an ATR of 1.5, the upper and lower bands are 103 and 97.
How does the Keltner Channel differ from Bollinger Bands?
Keltner uses ATR for its width, which changes more steadily; Bollinger uses the standard deviation of closes, so it shrinks narrower when things are quiet and opens wider in a trend. For Bollinger’s trade-offs, see How to read Bollinger Bands.
What is a squeeze?
When the whole of the Bollinger Bands shrinks inside the Keltner Channel, it is usually called a squeeze, and it means recent volatility is very low. It is often used to watch for “the market about to start moving”, but it says nothing about direction.
Does MT5 have the Keltner Channel?
MT5 has no built-in Keltner Channel; you need to install a custom indicator. Bollinger Bands, on the other hand, are built into MT5.
Conclusion
Keltner and Bollinger, one using ATR and the other standard deviation, both measure volatility, but they react differently to calm and to turbulence. Lay the two over each other and you can see something neither shows on its own: how low volatility is right now compared with usual.
So the real question is: on your instrument, after a squeeze, is the breakout direction worth following? One stretch of historical prices cannot answer that. Backtest it with our AI Strategy Assistant and you will know.
Write the condition as one sentence, for example “after the Bollinger Bands shrink inside the Keltner Channel, enter when the close breaks above Keltner’s upper band”, give it to MASQuant’s AI Strategy Assistant, and press go to start the backtest. The backtest environment includes real market frictions such as spreads, slippage, changes in market liquidity and execution delays (see the AI Strategy Assistant guide for how to use it). A backtest tells you “how this rule performed in past market conditions”, not a guarantee about the future.
An idea only becomes a strategy once it’s been tested.
The price chart in this article is taken from historical prices on the MT5 platform (daily; quotes and daily candle cut-off times differ slightly between platforms, so values may not match exactly), and the indicators are calculated by a program using the standard formulas; the round numbers in the example are not market data. Historical prices are used only to show how the indicator behaves and do not represent future price movements.
Risk disclosure: CFDs are high-risk financial products and can lead to rapid loss of capital. Past performance does not guarantee future results. All strategies and backtests are for reference only and do not constitute investment advice. Please read our Risk Disclosure carefully before trading.
Further reading:


