
How to Read the RSI Indicator? Should You Sell at RSI 70? Accurate in Ranges, Stuck High in Trends
“RSI has reached 70 — time to sell, right?”
RSI is almost everyone’s first oscillator, and “70 is overbought, 30 is oversold” is one of the most quoted lines in trading. Half of it is true: in a range, RSI pulling back from 70 and bouncing from 30 is often so accurate it feels like a cheat code.
The other half is said less often: once a trend starts, RSI can stay above 70 for a long time — overbought can stay overbought.
This is part one of MASQuant’s “Trading Academy · The Truth About Indicators” series. Rather than a full introduction to RSI, this part covers one thing: why RSI behaves like two different indicators in two kinds of market, and how to use it on the instrument you trade.
The short answer
In a range, RSI’s 70 and 30 work well; once a trend starts, RSI gets stuck, and overbought can stay overbought.
So RSI has to be used according to the type of market.
What does the RSI indicator measure?
RSI stands for Relative Strength Index. It was introduced by J. Welles Wilder Jr. in 1978 and measures just one thing:
Over the recent period, how much of the movement has been upward.
Its value ranges from 0 to 100. When the price has recently risen a lot and fallen little, RSI is high; when it has fallen a lot and risen little, RSI is low. The usual setting is 14, meaning it looks at the last 14 bars.
The RSI formula: average gain and average loss
Compare each of the last 14 bars with the previous bar’s close: if it closed higher, note how much it rose; if it closed lower, note how much it fell. Then work out the average gain and the average loss separately:
RS = average gain ÷ average loss
RSI = 100 − 100 ÷ (1 + RS)
Written another way, these two lines are simply “the share of upward strength in all the strength”:
RSI = average gain ÷ (average gain + average loss) × 100An easy example (these are round numbers for illustration, not market data): over the last 14 bars, the up bars rose 28 in total and the down bars fell 14 in total:
Average gain = 28 ÷ 14 = 2
Average loss = 14 ÷ 14 = 1
RS = 2 ÷ 1 = 2
RSI = 100 − 100 ÷ (1 + 2) ≈ 66.7
Upward strength makes up two thirds, so RSI is 66.7; when upward and downward strength are exactly equal, RSI is 50.
The first average is a simple average; after that, with each new bar, Wilder’s method weights the old average together with the new bar:
New average gain = (previous average gain × 13 + this bar’s gain) ÷ 14The average loss works the same way. So RSI does not shoot straight to the top on a single big up bar, but during a run of gains it keeps building higher.
70 overbought, 30 oversold
- Above 70 is called overbought: upward strength has made up more than 70% of recent movement.
- Below 30 is called oversold: downward strength has made up more than 70% of recent movement.
Note that these two words describe “it has risen a lot recently” or “it has fallen a lot recently” — they describe strength that has already happened, not the direction from here. That is the key to the difference between the two kinds of market below.
One reminder: RSI in different charting software can differ slightly in how it is smoothed and how it starts, and values near the beginning of the data are also affected by the starting point. When you switch platforms, check the settings and the method before comparing values.
In a range: RSI is accurate
Start with the chart below (an illustrative series calculated by a program, not a real instrument; the grey background marks the range). The price moves up and down within a band, with no direction.
Here, at ① RSI rises above 70, and then at ② the price pulls back; at ③ RSI falls below 30, and then at ④ the price rebounds. Sell at 70, buy at 30 — in this stretch it looks like a cheat code.
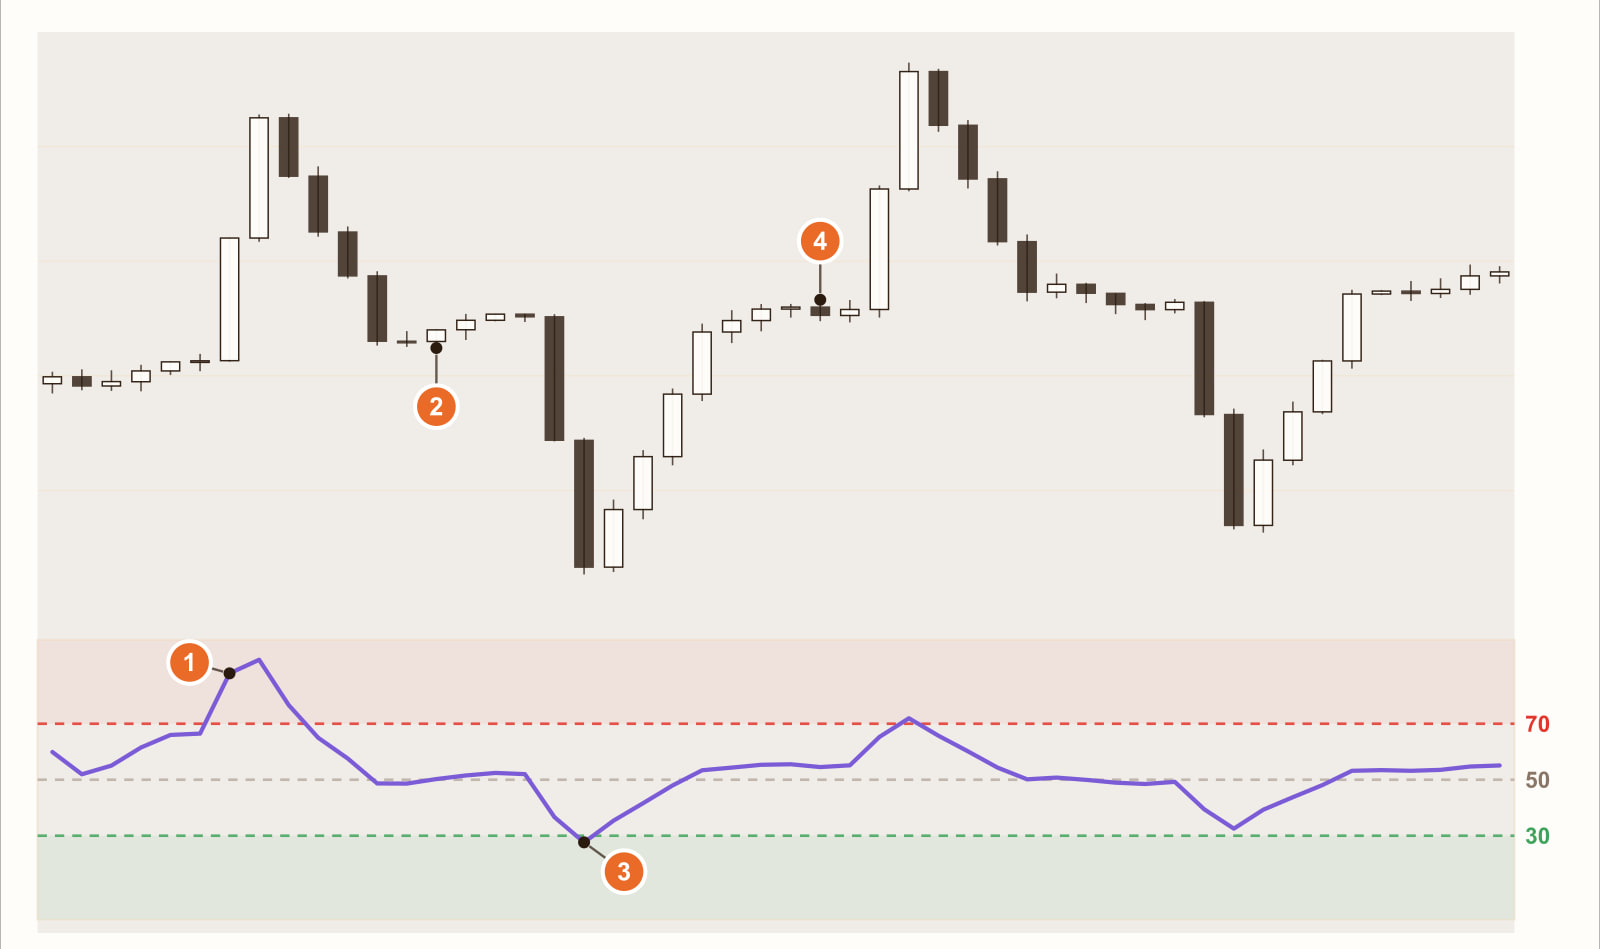
Why does it work in a range? The calculation explains it: when the price moves back and forth within a band, each leg up is followed by a leg down, and upward and downward strength take turns on top. RSI reaching 70 means the recent move up was very concentrated; in a market with no direction, that kind of concentration rarely lasts, so the price drifts back to the middle of the range and RSI falls back with it.
In a trend: RSI gets stuck, and overbought can stay overbought
Then the market moves into a strong rise.
In the chart, after RSI first touches 70 at ①, it stays above 70 for 41 bars in a row (② the shaded stretch), peaking at 97.1 — this is what traders call RSI getting “stuck” or “saturated”. If you had sold when it first touched 70, the price then rose by as much as another 26.6% (③). What you sold at 70 may have been the start of the whole move.
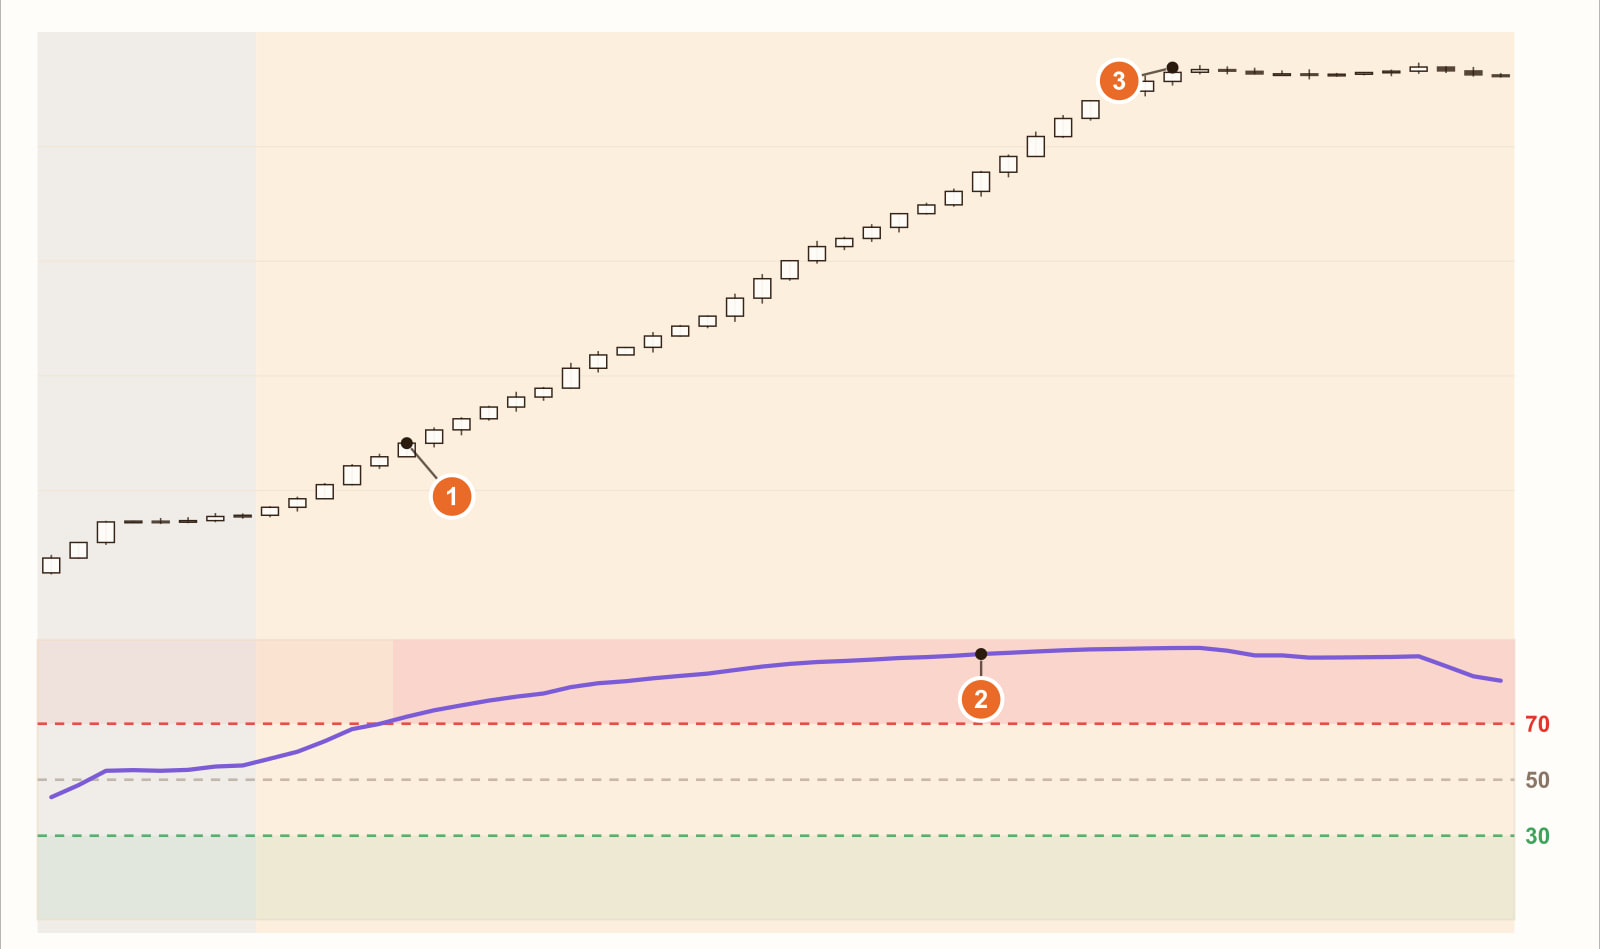
The reason is also in the calculation: in a trend, the gains keep outweighing the losses. The average gain keeps building while the average loss stays small, so RSI naturally sits high for a long time. At this point, “overbought” describes “this rise is strong”, not “it is about to fall”.
Overbought can stay overbought; oversold can stay oversold.
It works the same way in a downtrend: RSI can stay below 30 for a long time, and “buy when oversold” means catching a falling knife all the way down.
These numbers come from this illustrative series and are meant to show RSI’s character, not a general rule. Change the instrument, the timeframe or the setting and the numbers change — how many bars RSI stays stuck on your instrument, or whether it gets stuck at all, is something you have to test yourself.
How to read the RSI indicator: three questions first
RSI itself does not tell you whether you are in a range or a trend. So instead of asking “should I sell at RSI 70?”, think these three questions through before you see 70.
1. Is this a range or a trend?
This is the most important question, because the same 70 means very different things in the two kinds of market. Common ways to judge it are to look at the price structure — are the highs and lows stepping steadily higher or lower, or moving back and forth within a band? — or to see whether a longer moving average has a clear direction.
2. 70/30 is a position, not a direction
RSI above 70 only means the recent rise was very concentrated. Some traders wait for RSI to drop back below 70 from above before treating it as a sign of weakening, instead of acting the moment it touches 70; this is a little later, but you get run over by trends less often. Once again, it is a trade-off between acting early and waiting for confirmation.
3. If you are wrong, where do you get out?
However you use RSI, there will be times a trend runs you over. With rules that use RSI to trade against the move, decide in advance where you get out if you are wrong — that is the job of the stop loss; see “How to Set a Stop Loss?”.
Common mistakes
1. Selling at 70 and buying at 30 regardless of the type of market
A rule that works in a range becomes trading against the trend once the market is trending. In the trend part of the illustration, it means selling at 70 and watching the price rise another 26.6%.
2. Shortening the setting because RSI feels too slow
Make 14 smaller and RSI becomes more sensitive, touches 70 and 30 more often, and gives more — and noisier — signals; make it larger and it becomes smoother and touches the extremes less often. Tweaking the setting back and forth just switches sides between speed and accuracy. Tuning the same stretch of data again and again until it looks perfect also makes it easy to end up with a setting that only fits the past.
3. Treating overbought and oversold as “a reversal is guaranteed”
Overbought and oversold describe strength that has already happened. In a strong market, RSI can stay above 70 for a long time; in a weak market, it can stay below 30 for a long time. They describe a position, not a coming reversal.
FAQ
What is the RSI indicator and how is it calculated?
RSI (Relative Strength Index) measures how much of the recent movement has been upward, with values from 0 to 100; the usual setting is 14. To calculate it, find the average gain and average loss over the last 14 bars; RS = average gain ÷ average loss, and RSI = 100 − 100 ÷ (1 + RS).
Should you sell at RSI 70 and buy at RSI 30?
Not necessarily. Above 70 is called overbought and below 30 oversold; they describe recent rising and falling strength. In a range, RSI touching 70 is often followed by a pullback and touching 30 by a rebound; but in a trend, RSI can stay above 70 or below 30 for a long time — it gets stuck. Whether the rule works depends on whether your instrument ranges more or trends more, and only a backtest can tell you.
What does it mean when RSI gets stuck?
RSI getting stuck (or saturated) means that during a strong rise RSI stays above 70 for a long time (or, in a fall, below 30), so the overbought or oversold reading loses its value as a reversal signal. The reason is that in a trend the gains keep outweighing the losses, so the average gain keeps exceeding the average loss.
Does the RSI setting have to be 14?
Not necessarily. 14 is what Wilder originally suggested and the default in most charting software, but it is not the answer. A shorter setting makes RSI more sensitive and more likely to touch 70 and 30; a longer one makes it smoother. Which setting suits you depends on the instrument, the timeframe and how you trade, and you have to test it yourself.
What is the difference between RSI and KD?
RSI compares rising and falling strength over the recent period, while KD looks at where the close sits within the recent high–low range. Both range from 0 to 100, both talk about overbought and oversold, and both can get stuck in trends. For KD’s trade-off, see “Should You Buy on a KD Golden Cross?”.
Final thoughts
RSI’s accuracy is real: in a range, the pullback from 70 and the bounce from 30 often play out again and again. RSI getting stuck is real too: once a trend starts, overbought can stay overbought. Both come from the same calculation; you cannot keep just one half.
So the real question isn’t “is RSI accurate?” but: does the instrument you trade spend more time ranging or trending? In which kind of market can you trust RSI? One illustration can’t answer that — backtest it with our AI Strategy Assistant and find out.
Write the conditions in one sentence, such as “buy when RSI falls below 30, exit when it rises above 70”, drop it into MASQuant’s AI Strategy Assistant, and the backtest starts with a click. The backtest environment includes real-world market frictions such as spreads, slippage, changing liquidity and execution delays (see the Strategy Assistant User Guide for how it works). A backtest tells you “how this rule performed in past markets”, not a guarantee about the future.
An idea only becomes a strategy once it has been tested.
The charts and numbers in this article come from an illustrative series calculated by a program and do not represent the real price movement of any instrument.
Risk disclosure: CFDs are high-risk financial products and can lead to rapid loss of capital. Past performance does not guarantee future results. All strategies and backtests are for reference only and do not constitute investment advice. Please read our Risk Disclosure carefully before trading.
Further reading:


