
What Is the Rate of Change (ROC)? Why ROC Jumps When the Price Hasn’t Moved
“The price barely moved today, so why did ROC suddenly jump from negative to positive?”
The answer isn’t in today; it’s 12 bars back. ROC only compares today with “the day N bars ago”, and when that day is swapped out, ROC changes with it. If the bar being swapped out happens to be a surge or a crash, ROC jumps on its own. This article first works through 7 candles, then uses a real chart marked 1 to 4 (USD/JPY, 2026) to show what this “echo” looks like.
This article is part of MASQuant’s “Trading Academy · Technical Indicators” series. All the indicators are sorted by category in Technical Indicators: The Complete Guide.
In one sentence
ROC = how much today’s price has risen or fallen, in %, compared with N bars ago.
The question it answers: “Compared with one particular day, is the price up or down now, and by how much?”
ROC is like a year-on-year growth rate: this May’s sales compared with last May’s. If last May happened to include one exceptionally large order, this May’s growth rate will look terrible, not because this year got worse, but because the baseline was unusually high. Half of the ROC figure depends on today, and half on the day it is being compared with.
Work it out once: the price doesn’t move, yet ROC jumps
To keep the arithmetic easy, use a 3-bar ROC (today compared with 3 bars ago). On day 4 the price falls from 100 to 90, and then it stays at 90 (the following are round numbers made up for the example, not market data):
| Day | Close | Close 3 bars earlier | ROC(3) |
|---|---|---|---|
| Day 4 | 90 | 100 | (90 − 100) ÷ 100 × 100 = −10% |
| Day 5 | 90 | 100 | −10% |
| Day 6 | 90 | 100 | −10% |
| Day 7 | 90 | 90 | (90 − 90) ÷ 90 × 100 = 0% |
On days 5, 6 and 7 the price does not move at all. But on day 7, the day being compared against switches from “100, before the drop” to “90, after the drop”, and ROC jumps straight from −10% back to 0%. The drop on day 4 stays in ROC for 3 bars and then vanishes all at once. Set the period to 12 and it stays for 12 bars.
The formula
The usual setting is 12 (some people use 9, 10 or 14):
ROC = (today's close − close 12 bars ago) ÷ close 12 bars ago × 100

Above 0: higher than 12 bars ago
Below 0: lower than 12 bars ago
MT5 has two related indicators, and their calculations differ slightly:
- The ROC in MT5’s examples (Rate of Change, default 12): it divides by “today’s price” rather than “the price 12 bars ago”. So a 10% rise shows as 9.09 and a 10% fall as −11.11, slightly different from the standard calculation above.
- MT5’s built-in Momentum (default 14): it calculates “today ÷ N bars ago × 100”, where 100 means no change and 101 means 1% higher. It is essentially the same as ROC, just with 0 replaced by 100.
The chart in this article uses the standard calculation above. Before comparing values across platforms, check which one is being used.
Read the chart: USD/JPY in 2026, following 1 to 4
The chart below shows USD/JPY (USDJPY) on the daily timeframe from early March to late June 2026, taken from MT5’s historical prices. Over the whole stretch it went from 157.689 to 161.529, with one very large bearish candle on 30 April along the way. The grey shading marks the 12 bars during which that bearish candle was still inside ROC.
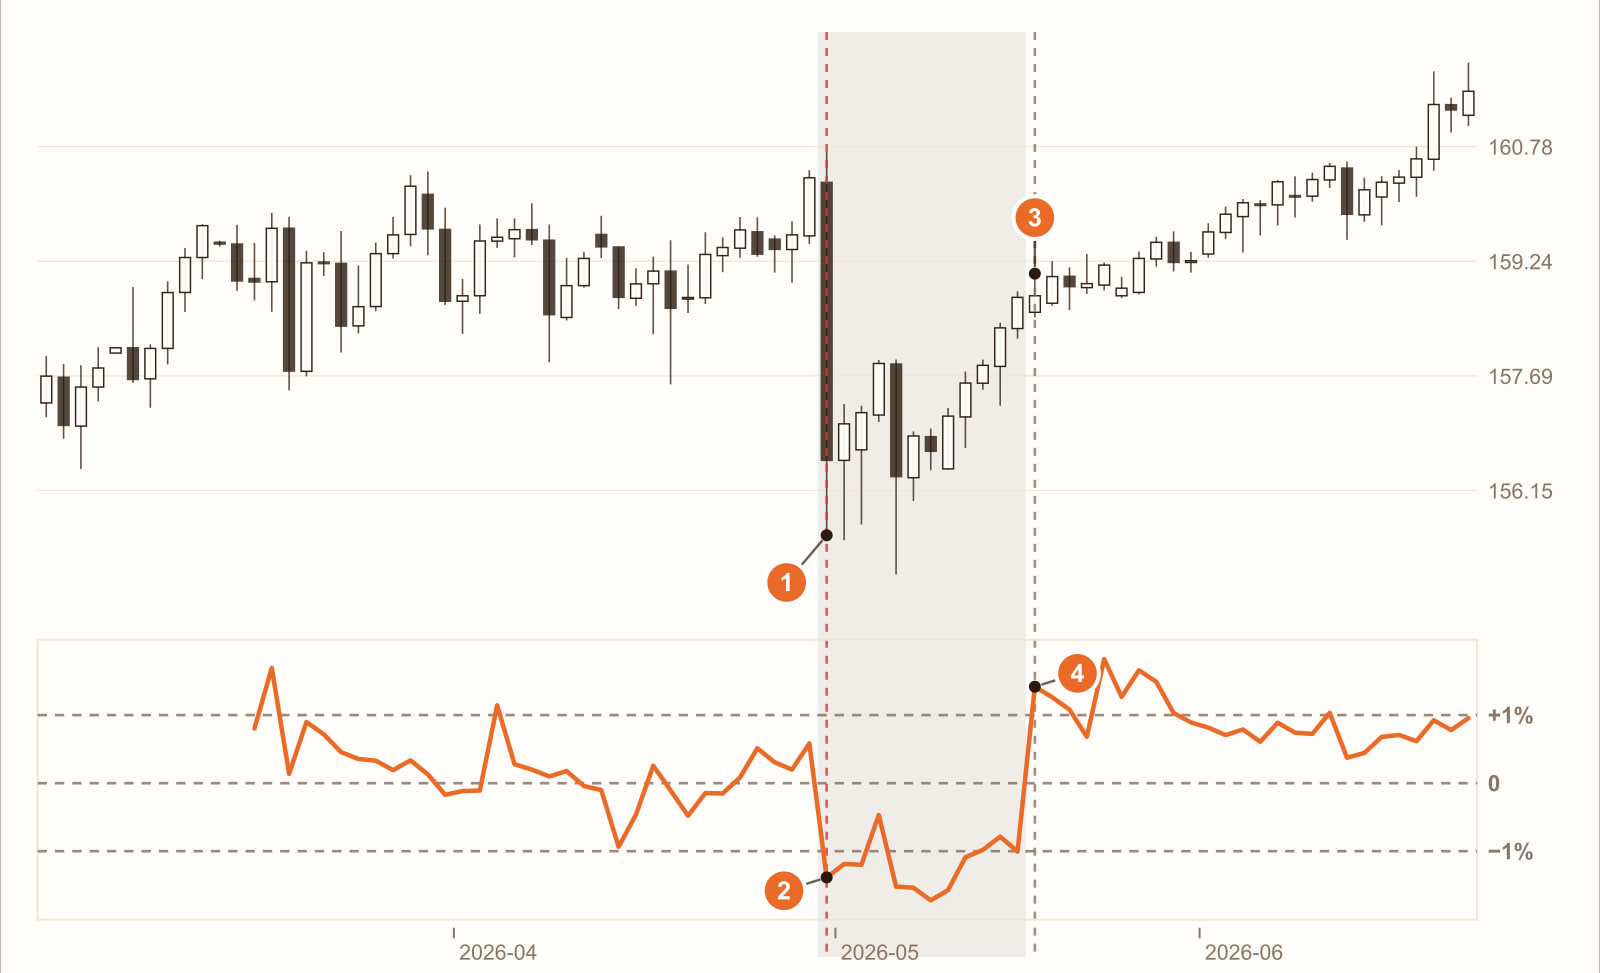
A 2.38% fall in one day (30 April 2026). This day’s drop was about 4.5 times the average true range (ATR), the largest candle of the whole stretch.
ROC follows it down: from +0.58% to −1.38%. A big drop today, compared with 12 bars ago, naturally comes out negative. That makes perfect sense.
12 bars later, the price barely moves (18 May 2026, +0.01%). That day closed at 158.773, almost the same as the day before.
Yet ROC jumps from −1.00% to +1.42%, a jump of 2.42 percentage points in one day. The reason is that the day being compared against changed: the previous day was compared with a price from before the drop, while this day is compared with the close after the 30 April drop, 156.554. Nothing happened today, yet ROC looks as if a big bullish candle had appeared. This is ROC’s “echo”.
This is a real stretch of historical prices, used to show how ROC behaves. It is not a general rule. Change the instrument, the timeframe or the period, and every number will change.
What you see, what it means
| What you see | What it usually means | But be careful |
|---|---|---|
| ROC above 0 | Higher than N bars ago | It only compares against one point; it doesn’t mean the price rose all the way in between |
| ROC below 0 | Lower than N bars ago | Same as above |
| ROC turns from negative to positive | The price is now above where it was N bars ago | It may also be that “the day being compared against” was swapped out; today may not have risen at all (4 on the chart) |
| The price makes a new high, but ROC is lower than last time | The rally is slowing | It doesn’t mean a reversal, only that the gap versus N bars ago has narrowed |
| ROC suddenly jumps while the price is flat | A very large candle from N bars ago has just dropped out | Count back N bars and you will usually find the cause |
How to use it: three examples
Example 1: as a momentum filter
The rule can be written as: “Only go long when ROC(12) is above 0.” In other words, “the price is higher now than 12 bars ago”, so only trend-following trades are taken. This is the simplest and most common use.
Example 2: comparing which instrument is stronger
ROC is a percentage, so instruments at very different price levels can be compared directly. For example, look at the 20-bar ROC of gold, silver and an index side by side, and only go long on the strongest one.
Example 3: avoiding false signals caused by the echo
If the rule is “enter when ROC turns from negative to positive”, you can add a condition: “that day’s close must also be higher than the previous day’s.” Flips like the one at 4 on the chart, where “the price didn’t move and only the baseline changed”, will then be filtered out.
All three examples need to keep one thing in mind: ROC only compares two points. Today’s point and the point N bars ago; whatever happened in between, it ignores. The more unusual the day N bars ago, the more easily ROC jumps on its own.
Common mistakes
1. Assuming the price rose today because ROC turned positive
At 4 on the chart, the price rose only 0.01%, yet ROC jumped from −1.00% to +1.42%. It turned positive because the big bearish candle from 12 bars earlier left the calculation window, not because there was buying today.
2. Comparing ROC values directly across platforms
The standard calculation divides by the price N bars ago, MT5’s example ROC divides by today’s price, and MT5’s Momentum is centred on 100. For the same “10% rise”, the three show 10, 9.09 and 110.
3. Changing the period on a whim
ROC(9) and ROC(14) compare against different days, so their echoes show up at different times. Change the period and the signals move with it; you need to test again rather than carry the old results over.
FAQ
What is the ROC indicator?
ROC (Rate of Change) is a momentum indicator that calculates how much today’s price has risen or fallen, in %, compared with N bars ago; the usual period is 12. Above 0 means higher than N bars ago, and below 0 means lower.
How are ROC and Momentum different?
They are essentially the same: both compare today with N bars ago. ROC is centred on 0 and expressed in %; MT5’s built-in Momentum is “today ÷ N bars ago × 100”, centred on 100.
Why does ROC suddenly jump?
Because the day it is compared against changes every day. If there was an unusually large candle N bars ago, ROC jumps on the day that candle leaves the calculation window, even if the price barely moved that day.
Does MT5 have ROC?
The example indicators installed with MT5 (in the Examples folder) include Rate of Change, with a default period of 12; it divides by today’s price, so its values differ slightly from the standard calculation. The built-in one in MT5’s indicator list is Momentum.
Conclusion
ROC is direct: how much today has risen compared with N bars ago, in %. Its weakness is just as direct: the baseline it compares against changes every day, and the more unusual the baseline day, the more the number jumps on its own.
So the real question is: if your entry rule uses “ROC turns from negative to positive”, how many of those signals were really just the day 12 bars earlier being swapped out? One stretch of historical prices cannot answer that; you have to backtest the rule over many stretches of the market.
Don’t have rules of your own yet, and don’t want to piece them together one indicator at a time? With MASQuant’s Strategy Genie, you just choose an investment style first; the AI analyses market conditions, selects instruments and gives you three candidate strategies at once. Each one has already been backtested on historical data, with its returns and maximum drawdown laid out in the open, and then you decide whether to deploy it to MT5.
If you already have an idea of your own, write the condition as one sentence, for example “only go long when ROC(12) is above 0 and the day’s close is higher than the previous day’s”, give it to the AI Strategy Assistant, and press go to start the backtest. The backtest environment includes real market frictions such as spreads, slippage, changes in market liquidity and execution delays (see the AI Strategy Assistant guide for how to use it). Then remove “the day’s close is higher than the previous day’s” and run it again, and you will see how many false signals the echo was causing. A backtest tells you “how this rule performed in past market conditions”, not a guarantee about the future.
An idea only becomes a strategy once it’s been tested.
The price chart in this article is taken from historical prices on the MT5 platform (daily; quotes and daily candle cut-off times differ slightly between platforms, so values may not match exactly), and the indicators are calculated by a program using the standard formulas; the round numbers in the example are not market data. Historical prices are used only to show how the indicator behaves and do not represent future price movements.
Risk disclosure: CFDs are high-risk financial products and can lead to rapid loss of capital. Past performance does not guarantee future results. All strategies and backtests are for reference only and do not constitute investment advice. Please read our Risk Disclosure carefully before trading.
Further reading:


