
What Is the TRIX Indicator? Smoothed Three Times: Less Noise, but Later Signals
“TRIX has already turned down. Isn’t it time to sell?”
First, look at what TRIX is: it smooths the price three times, then looks at how many percent that very flat line changes each day. When TRIX turns down, it only means the line is “rising more slowly”; the line itself may still be going up. This article first works it out once with a table, then uses a real chart marked 1 to 4 (the Germany 40 index, 2019–2020) to show what triple smoothing buys you, and what it costs.
This article is part of MASQuant’s “Trading Academy · Technical Indicators” series. All the indicators are sorted by category in Technical Indicators: The Complete Guide.
In one sentence
TRIX = how many percent the “triple-smoothed price line” changes each day.
Above 0 means that line is rising; below 0 means it is falling. How high or low TRIX itself is tells you how fast it is rising or falling.
TRIX is like a car’s speedometer, not its odometer. When a car slows gradually from 100 km/h to 60 km/h, the speedometer keeps dropping, but the car is still moving forward; only when the speed reaches 0 and the car starts reversing is it really going back. TRIX falling = slowing down; TRIX crossing 0 = turning around. There can be a long time in between.
Work it out once: TRIX falls, the line still rises
Suppose the line below is already “the line after smoothing three times”. How many percent it changes each day is TRIX (the following are round numbers made up for the example, not market data):
| Day | Triple-smoothed line | Change from the day before | TRIX |
|---|---|---|---|
| Day 2 | 101.0 | Up 1.0 from 100.0 | +1.00% |
| Day 3 | 101.8 | Up 0.8 | +0.79% |
| Day 4 | 102.4 | Up 0.6 | +0.59% |
| Day 5 | 102.8 | Up 0.4 | +0.39% |
| Day 6 | 103.0 | Up 0.2 | +0.19% |
| Day 7 | 103.0 | No change | 0.00% |
| Day 8 | 102.8 | Down 0.2 | −0.19% |
From day 3 onwards TRIX keeps falling, yet the line itself keeps rising until day 6; it only stops on day 7 and only starts falling on day 8. TRIX peaks before the price does, but TRIX crosses 0 after the price has peaked. You can see both of these in the real prices below.
The formula
The usual setting is 14 or 15:
1 EMA1 = 14-period EMA of the close
2 EMA2 = 14-period EMA of EMA1
3 EMA3 = 14-period EMA of EMA2 (the triple-smoothed line)
4 TRIX = (today's EMA3 − yesterday's EMA3) ÷ yesterday's EMA3 × 100

Signal line: 9-period EMA of TRIX (some traders add it)
TRIX was introduced by Jack Hutson in the 1980s. Triple smoothing filters out almost all the short-term wobbles and leaves only the longer move; the common ways to use it are to watch it cross the zero line, or to watch it cross its own signal line.
MT5 has a built-in TRIX (Triple Exponential Average), with a default of 14. Two things to note: MT5’s TRIX is not multiplied by 100, so the 0.26% in this article shows up as 0.0026 in MT5; and it comes without a signal line.
Read the chart: the Germany 40 index in 2019–2020, following 1 to 4
The chart below shows the Germany 40 index (GER40) on the daily timeframe from May 2019 to March 2020, taken from MT5’s historical prices. It went through a range, a rally and a sharp sell-off in turn: from May to early October 2019 it closed between 11,410 and 12,654; from early October to 17 February 2020 it rose from 11,912 to 13,782; after that, in the global stock market crash of late February and March 2020, it fell all the way to 8,869 on 17 March. In the top panel, the purple line is the 14-period EMA and the orange line is the triple-smoothed EMA3.
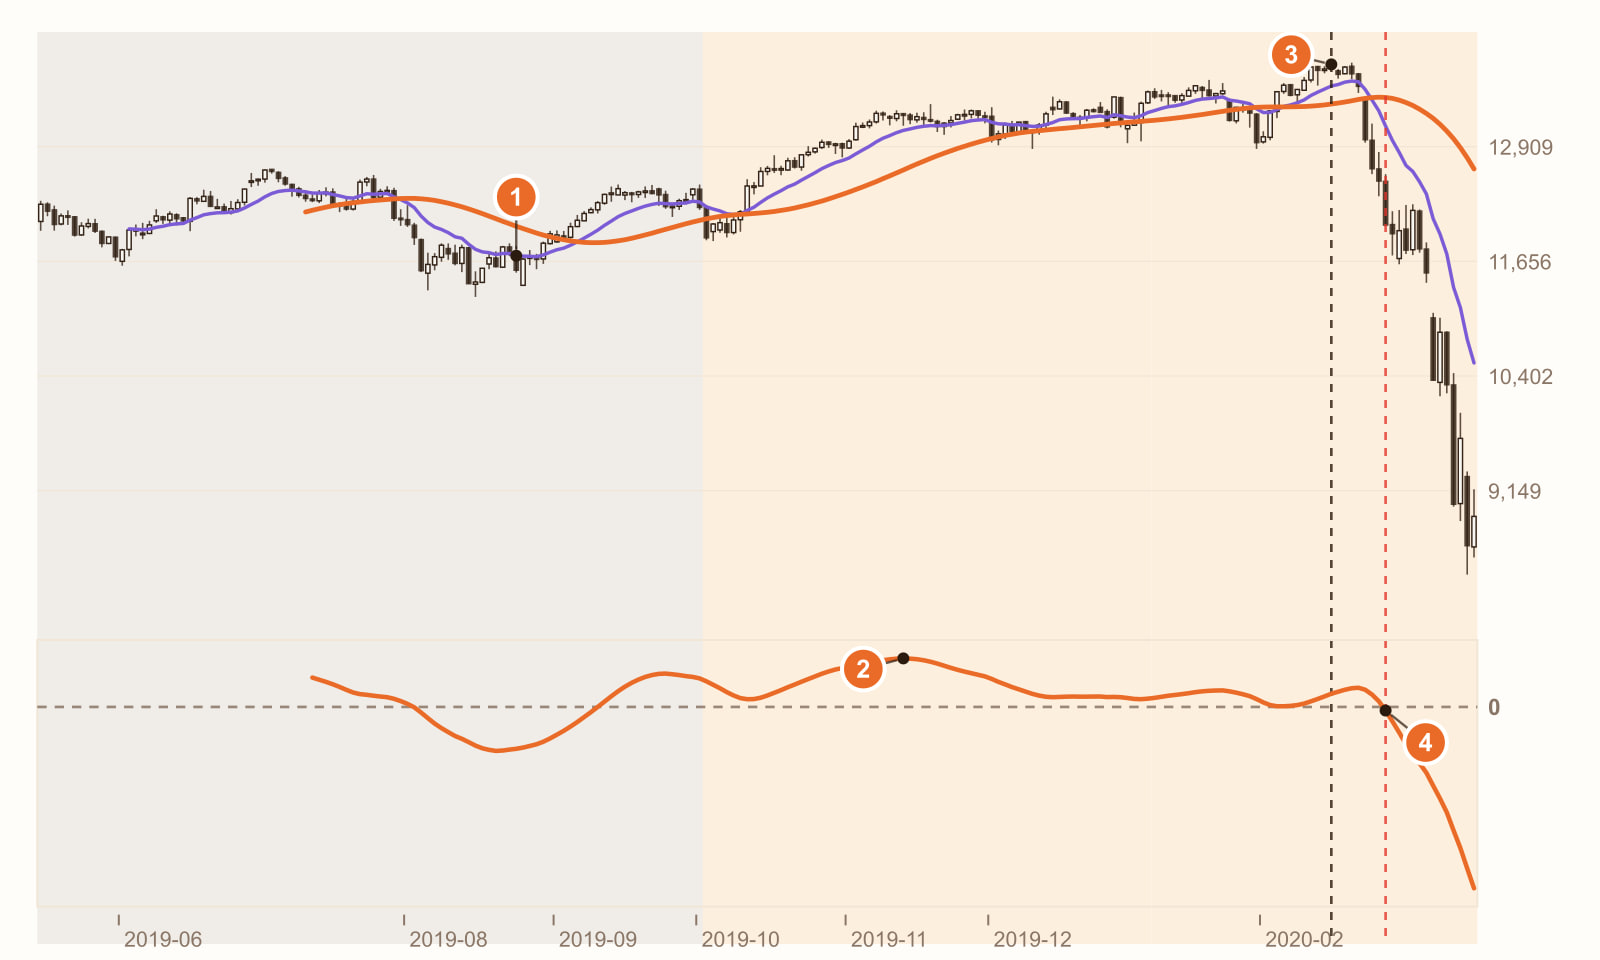
In the range, TRIX stays quiet (23 August 2019). Over the 53 bars counted from when TRIX first had a value, the 14-period EMA changed direction 10 times, while TRIX crossed 0 only twice. Smoothing three times filtered out almost all the back-and-forth in the range.
TRIX peaks: 13 November 2019, at 0.256%. This is when the rally was fastest, 63 bars before the price high. TRIX started falling from this day, yet the price rose another 4.0% before it peaked: a falling TRIX only meant “the rise was slowing”.
The price peaks: 17 February 2020, closing at 13,782. Counted from the start of the rally, this leg gained 15.7%. The 14-period EMA turned soon after: it peaked on the 3rd bar after the high and started falling the next day, when the price was 1.6% below the high.
TRIX turns negative: the 8th bar after the high (27 February 2020). By then the price was already 12.6% below the high. This fall was fast and steep, and the triple-smoothed TRIX could not keep up. By 17 March, the price was 35.7% below the high.
This is a real stretch of historical prices, used to show how TRIX behaves. It is not a general rule. Change the instrument, the timeframe or the period, and every number will change.
What you see, what it means
| What you see | What it usually means | But be careful |
|---|---|---|
| TRIX above 0 | The triple-smoothed line is rising | It reacts much more slowly than the price |
| TRIX below 0 | The triple-smoothed line is falling | In a sharp fall it turns negative very late (4 on the chart) |
| TRIX falls from a peak | The rally is slowing | The price may still be rising (2 on the chart: it rose another 4.0% afterwards) |
| TRIX hugs the area around 0 | No clear direction | This is exactly where it filters out the noise (1 on the chart) |
| TRIX crosses its own signal line | The direction of the speed has changed | The signal line is smoothed once more, so it is slower still |
How to use it: three examples
Example 1: as a filter for the trend direction
The rule can be written as: “Only go long when TRIX is above 0; only go short when it is below 0.” TRIX rarely flips back and forth in a range, so it suits a background read of direction, not precise entry and exit points.
Example 2: spotting a rally that is slowing
When the price makes a new high but TRIX is lower than at its previous peak, the rally is slowing. Treat it as a reminder to “move the stop a little closer”, not as a reason to flip straight to short: after 2 on the chart, the price rose another 4.0%.
Example 3: TRIX for direction, a faster indicator for exits
TRIX is slow, so exits can be left to something faster, such as “exit when the price falls below the 14-period EMA” or a fixed ATR stop (see What is the ATR indicator?). After 3 on the chart, the EMA turned on the 3rd bar, while TRIX took until the 8th.
All three examples have to accept the same thing: TRIX trades time for quiet. It says far fewer wrong things in a range, and the price is that it is also the last to speak up when the market really turns.
Common mistakes
1. Selling as soon as TRIX turns down
A falling TRIX only means slowing down. On the day TRIX peaked at 2 on the chart, the price went on rising for another 63 bars, and another 4.0%, before it peaked.
2. Treating TRIX turning negative as a timely stop
In a sharp fall, a triple-smoothed indicator reacts very slowly. At 4 on the chart, by the time TRIX turned negative the price was already 12.6% below the high. Set your stop separately.
3. Comparing TRIX values across platforms directly
Some platforms multiply by 100 and some do not (MT5 does not), and the period may be 14, 15 or 18. A value 100 times different does not mean the indicator is broken; the units are different.
FAQ
What is the TRIX indicator?
TRIX (Triple Exponential Average) smooths the close three times with EMAs and then calculates the daily rate of change. Above 0 means the smoothed line is rising and below 0 that it is falling; the common periods are 14 or 15.
How do you read TRIX?
The most common ways are to watch TRIX cross the zero line, or to watch TRIX cross its 9-period signal line. How high or low TRIX is reflects speed: falling from a peak means slowing down; only a cross of 0 means the direction has changed.
How is TRIX different from MACD?
Both look at smoothed momentum. MACD is the distance between a fast and a slow EMA; TRIX is the rate of change of a single line smoothed three times. TRIX is smoothed more, so it is quieter, and also slower.
Does MT5 have TRIX?
Yes. MT5 has a built-in Triple Exponential Average with a default period of 14; its values are not multiplied by 100, and there is no signal line.
Conclusion
TRIX makes an honest trade-off: it filters out the noise, and the price is speed. In a range it almost never raises a false alarm; in a sharp fall it almost never gets the alarm out in time.
So the real question is: if your strategy uses TRIX as a direction filter, do the false signals it removes make up for the stretch you lose by exiting late in a sharp fall? One stretch of historical prices cannot answer that; you need to backtest the rule across many stretches of the market.
No rules of your own yet, and don’t want to piece them together one indicator at a time? With MASQuant’s Strategy Genie, you just pick an investment style first: the AI analyses market conditions, selects instruments and gives you three candidate strategies at once. Each one has already been backtested on historical data, with its return and maximum drawdown of capital laid out for you to see, and then you decide whether to deploy it to MT5.
If you already have an idea of your own, write the condition as one sentence, for example “go long only when TRIX is above 0 and the close is above the 14-period EMA; exit when the price falls below the EMA”, give it to the AI Strategy Assistant, and press go to start the backtest. The backtest environment includes real market frictions such as spreads, slippage, changes in market liquidity and execution delays (see the AI Strategy Assistant guide for how to use it). Then change the exit condition to “TRIX below 0” and run it again, and you will see how much being one step slower costs. A backtest tells you “how this rule performed in past market conditions”, not a guarantee about the future.
An idea only becomes a strategy once it’s been tested.
The price chart in this article is taken from historical prices on the MT5 platform (daily; quotes and daily candle cut-off times differ slightly between platforms, so values may not match exactly), and the indicators are calculated by a program using the standard formulas; the round numbers in the example are not market data. Historical prices are used only to show how the indicator behaves and do not represent future price movements.
Risk disclosure: CFDs are high-risk financial products and can lead to rapid loss of capital. Past performance does not guarantee future results. All strategies and backtests are for reference only and do not constitute investment advice. Please read our Risk Disclosure carefully before trading.


