
What Is the Standard Deviation Indicator? Does a Rising Standard Deviation Mean the Market Is Getting Dangerous?
“Standard deviation is at a two-month high. The market is getting dangerous, so better stay out?”
First, look at what standard deviation measures: how far the last 20 closes are from their average. Not how much the price swings each day. A market that rises only a little each day, but keeps going in the same direction, pulls its closes further and further from the average, and the standard deviation grows. This article first works it out once with two sets of numbers, then puts standard deviation and ATR side by side on a real chart marked 1 to 4 (gold, 2025).
This article is part of MASQuant’s “Trading Academy · Technical Indicators” series. All the indicators are sorted by category in Technical Indicators: The Complete Guide.
In one sentence
Standard deviation = how “spread out” the last N closes are.
The question it answers: “How far are these closes from their average?” It does not answer “How big is each day’s jump?”
Standard deviation is like measuring how spread out a group of people is. One group jumps up and down on the spot: each person moves a lot, but everyone stays close to where they started, so the group is not spread out. Another group takes just one small step each, but they all line up in the same direction into a long queue, so the group is very spread out. Standard deviation measures “how long the queue is”, not “how high they jump”. How big each day’s jump is, that is what ATR measures.
Work it out once: big jumps don’t mean wide spread
Two sets of 5 closes each (the following are round numbers made up for the example, not market data):
| Situation | 5 closes | Daily move | Average | Standard deviation |
|---|---|---|---|---|
| A: big swings, going nowhere | 100, 104, 100, 104, 100 | 4 a day | 101.6 | 1.96 |
| B: small daily gains, steadily up | 100, 102, 104, 106, 108 | 2 a day | 104 | 2.83 |
B moves only half as much as A each day, yet its standard deviation is larger. The calculation: subtract the average from each close, square the result, add them all up, divide by 5 and take the square root. A’s closes all stay close to 101.6 (2.4 away at most); B’s first and last closes are each 4 away from the average. The steadier the trend and the further it travels, the larger the standard deviation.
The formula
The usual setting is 20:
1 Average = average of the last 20 closes (simple moving average)
2 Standard deviation = √(average of (each close − average)²)

Bollinger Bands = 20-period average ± 2 × standard deviation
Standard deviation is a basic tool of statistics, and in trading its most common use is the width of Bollinger Bands (see How to read Bollinger Bands). It is in the same units as the price: gold’s standard deviation runs to tens of dollars, EUR/USD’s to a few hundredths, so the numbers for different instruments cannot be compared directly. To compare them, convert to a percentage: “standard deviation ÷ price”.
MT5 has a built-in Standard Deviation, with a default of 20 periods, a simple moving average for the average and the close for the price: the same calculation as in this article.
Read the chart: gold in 2025, following 1 to 4
The chart below shows gold (XAUUSD) on the daily timeframe from early May to late September 2025, taken from MT5’s historical prices. It ranged first, then rallied: from 5 May to 7 August it closed between 3,177 and 3,433, with the first and last closes only 1.8% apart; from 8 August to 26 September it rose from 3,398 to 3,761, a gain of 10.7%. The dashed lines in the top panel are the 20-period average and the Bollinger Bands (± 2 standard deviations).
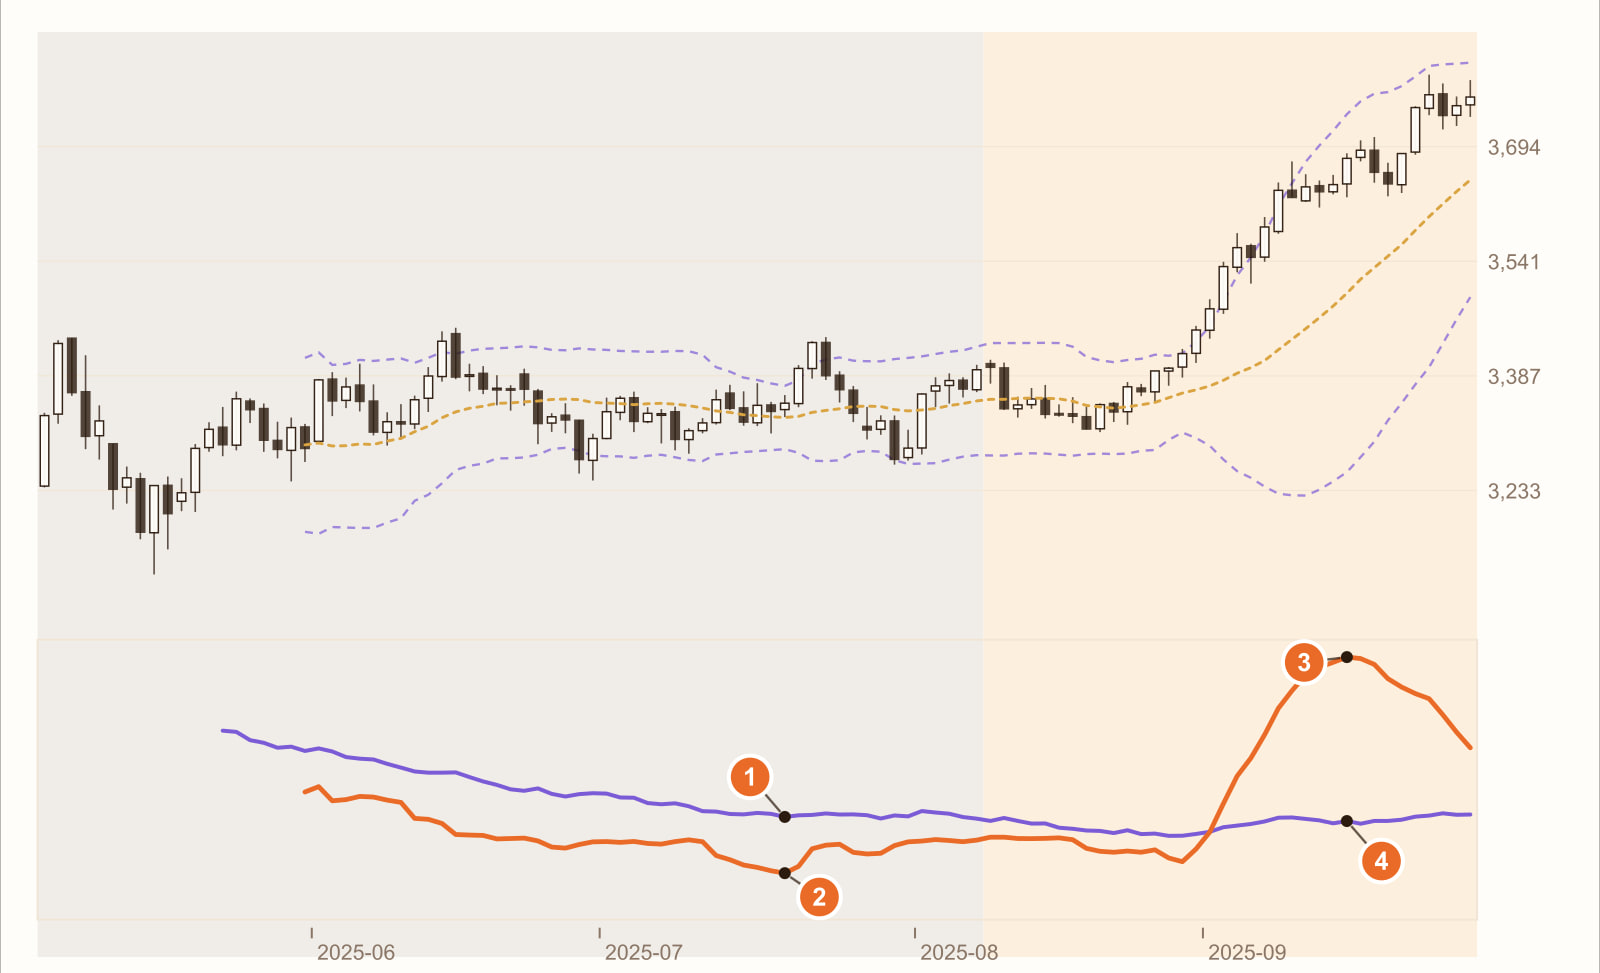
In the range, the daily swings were not small (18 July 2025, ATR 47.0). During this range, ATR averaged 1.69% of the price, higher than the 1.25% of the rally that followed. In other words, the daily high-low range was actually bigger while the market was ranging.
On the same day, standard deviation was only 21.2, less than half of ATR. The price swung a lot each day, but the closes kept circling within the same zone, never far from the average. Across the whole range, standard deviation averaged only 0.65 times ATR.
In the rally, standard deviation shot up to 120.0 (15 September 2025). As the price climbed, the last 20 closes lined up from low to high, further and further from their average. During the rally, standard deviation averaged 2.26 times ATR; as a percentage of the price, it rose from 1.11% in the range to 2.83%.
On the same day, ATR was only 45.1, about the same as in the range. The daily swings had not grown. Standard deviation rose because the price had “travelled far”, not because the market had “turned violent”. That is also why Bollinger Bands open widest in a steady rally.
This is a real stretch of historical prices, used to show how standard deviation behaves. It is not a general rule. Change the instrument, the timeframe or the period, and every number will change.
What you see, what it means
| What you see | What it usually means | But be careful |
|---|---|---|
| Standard deviation rises | Recent closes are more spread out | It may be a steady trend, not necessarily a more violent market (3 and 4 on the chart) |
| Standard deviation falls | Closes are bunched together | The daily swings are not necessarily small (1 and 2 on the chart) |
| Standard deviation far above ATR | The price is heading steadily in one direction | The trend may already have run a fair way |
| Standard deviation below ATR | Swinging every day, but going nowhere | The typical look of a range |
| Standard deviation shrinks to a very low level | The price is in a very narrow range | Often taken as a sign that “a move is coming”, but it does not say which way |
How to use it: three examples
Example 1: read it with ATR to tell trends from ranges
Divide one by the other: standard deviation ÷ ATR. Well above 1, the price is probably heading in one direction; below 1, it is probably going nowhere. On the chart, the range averaged 0.65 and the rally 2.26.
Example 2: a shrinking standard deviation as a hint of a coming move
The rule can be written as: “When standard deviation is at its lowest of the last 100 bars, wait for the price to break above the 20-bar high before going long.” This is the idea behind the Bollinger “squeeze”: contract first, then expand. A contraction only says “a move may be coming”; the direction only shows once there is a breakout (for an example of a squeeze, see What is the Keltner Channel?).
Example 3: set your stop distance with ATR, not standard deviation
A stop is there to guard against “normal daily swings”, and that is what ATR measures. Set a stop with standard deviation and it will be too wide in a steady trend and too narrow in a range: exactly the opposite of what you need.
All three examples need to keep one thing in mind: standard deviation measures distance, not speed. It tells you “how far the price is from its average”, not “how violently the price is jumping”.
Common mistakes
1. Treating a rising standard deviation as a more dangerous market
At 3 on the chart, standard deviation shot up to 120, the highest on this chart; ATR on the same day was only 45.1, about the same as in the range. That was a steady rally with modest daily swings.
2. Comparing standard deviations of different instruments directly
Standard deviation is in the same units as the price. Gold’s 50 and EUR/USD’s 0.005 cannot be compared; to compare them, first divide by the price and turn them into percentages.
3. Using standard deviation as your stop distance
In a steady rally standard deviation is large, so the stop ends up very far away; in a range it is small, so the stop ends up too close and gets swept out by the first wobble. ATR is better suited to measuring the daily swings.
FAQ
What is the standard deviation indicator?
Standard deviation measures how spread out the last N closes are around their average; the usual period is 20. It is in the same units as the price, and it is also what sets the width of Bollinger Bands.
How is standard deviation different from ATR?
ATR measures how big each candle’s high-low range is (how much the price swings each day); standard deviation measures how far a stretch of closes is from its average (how spread out they are). In a steady trend, standard deviation is large while ATR is not necessarily large; in a choppy range, ATR is large while standard deviation is not necessarily large.
How are standard deviation and Bollinger Bands related?
The upper and lower Bollinger Bands are simply the 20-period average plus and minus 2 standard deviations. When standard deviation rises, the Bollinger Bands widen.
Does MT5 have standard deviation?
Yes. MT5 has a built-in Standard Deviation, with a default of 20 periods, a simple moving average and the close.
Conclusion
Standard deviation is a very honest statistical tool: it only measures how spread out the closes are. Read it as “how dangerous the market is”, and you will be at your most nervous in the steadiest trends.
So the real question is: when your strategy says “don’t enter if standard deviation is too high”, is it keeping you out of dangerous markets, or out of the smoothest stretch of all? One stretch of historical prices cannot answer that; you need to backtest the rule across many stretches of the market.
No rules of your own yet, and don’t want to piece them together one indicator at a time? With MASQuant’s Strategy Genie, you just pick an investment style first: the AI analyses market conditions, selects instruments and gives you three candidate strategies at once. Each one has already been backtested on historical data, with its return and maximum drawdown of capital laid out for you to see, and then you decide whether to deploy it to MT5.
If you already have an idea of your own, write the condition as one sentence, for example “go long only when standard deviation ÷ ATR is above 1.5 and the price is above the 20-period average”, give it to the AI Strategy Assistant, and press go to start the backtest. The backtest environment includes real market frictions such as spreads, slippage, changes in market liquidity and execution delays (see the AI Strategy Assistant guide for how to use it). Then change the condition to “don’t enter if standard deviation is too high” and run it again; comparing the two results will tell you. A backtest tells you “how this rule performed in past market conditions”, not a guarantee about the future.
An idea only becomes a strategy once it’s been tested.
The price chart in this article is taken from historical prices on the MT5 platform (daily; quotes and daily candle cut-off times differ slightly between platforms, so values may not match exactly), and the indicators are calculated by a program using the standard formulas; the round numbers in the example are not market data. Historical prices are used only to show how the indicator behaves and do not represent future price movements.
Risk disclosure: CFDs are high-risk financial products and can lead to rapid loss of capital. Past performance does not guarantee future results. All strategies and backtests are for reference only and do not constitute investment advice. Please read our Risk Disclosure carefully before trading.
Further reading:


