
What Is Chaikin Money Flow (CMF)? Does CMF Above 0 Mean Money Is Flowing In?
“CMF has stayed above 0 the whole time, so money is flowing in. Surely it can’t fall very far?”
CMF’s “money flowing in” means far less than it sounds. It only looks at where each of the last 20 candles closed within its day’s high-low range: if most closed near the high, it is positive, whether those 20 bars were rising or falling. A decline in which the market opens lower each day, sells off, then climbs back from the lows can keep CMF positive all the way down. This article first works through three candles, then uses a real chart marked 1 to 4 (the S&P 500 index in early 2025) to show what that looks like in practice.
This article is part of MASQuant’s “Trading Academy · Technical Indicators” series. All the indicators are sorted by category in Technical Indicators: The Complete Guide.
In one sentence
CMF = over the last 20 bars, whether the volume came mostly on days that “closed near the high” or on days that “closed near the low”.
It ranges from −1 to +1. Above 0 means the days that closed near the high carried more volume; below 0 means the opposite.
CMF is like a coach who only watches the “last minute” of every game: if the team is clawing back points in the final minute of every game, the coach calls them resilient, even if they lost more games than they won all season. CMF looks at “where each day finishes”, not at “whether the whole stretch is rising or falling”.
Work it out once: falling all the way, yet CMF is positive
CMF uses the same position score, CLV, as A/D: a close at the day’s high scores +1, a close at the low −1, right in the middle 0. To keep the maths simple, we use 3 bars (the following are round numbers made up for the example, not market data). Over these three days the close falls from 98 to 96 and then to 94, but on the first two days the market opened lower, sold off, then climbed back to near the day’s high:
| Candle | Close | CLV (where it closed in the day) | Volume | CLV × volume |
|---|---|---|---|---|
| Bar 1 | 98 (down) | +0.8 (near the day’s high) | 100 | +80 |
| Bar 2 | 96 (down) | +0.6 | 100 | +60 |
| Bar 3 | 94 (down) | −0.5 (closer to the day’s low) | 120 | −60 |
CMF = (80 + 60 − 60) ÷ (100 + 100 + 120) = +0.25. All three days fell, yet CMF is positive, because most of the volume came on days that “closed near the day’s high”. CMF doesn’t know the price is lower than yesterday.
The formula
The usual setting is 20:
1 CLV = [(close − low) − (high − close)] ÷ (high − low)
2 CMF = sum of (CLV × volume) over the last 20 bars ÷ sum of volume over the last 20 bars
CMF was introduced by Marc Chaikin and uses the same CLV as A/D (see What is the Accumulation/Distribution (A/D) line?). The difference is that A/D keeps a running total, while CMF only looks at the last 20 bars and divides by total volume, so its value stays between −1 and +1 and can be compared across different periods. A common reading is that above 0 leans bullish and below 0 leans bearish; some traders use ±0.05 or ±0.1 as thresholds to cut down on flip-flopping around 0.
MT5 does not have a built-in CMF (the built-in one is the Chaikin Oscillator, a different indicator calculated from A/D), so you need to install a custom indicator.
On CFDs, take special care: CFDs mostly have no central exchange, so what is usually available in MT5 is tick volume: the number of times the price quote changed during the period, not how much actually traded. It is often used as a proxy for how active the market is, but it is affected by volatility, the quote source and the trading session, and the same instrument can give different values on different platforms.
Read the chart: the S&P 500 in early 2025, following 1 to 4
The chart below shows the S&P 500 index (US500) on the daily timeframe from mid-December 2024 to early April 2025, taken from MT5’s historical prices. The first part is a range (start and end only 0.8% apart); over the 50 bars from 27 January to 4 April 2025, it fell from 6,017 to 5,062, a drop of 15.9%.
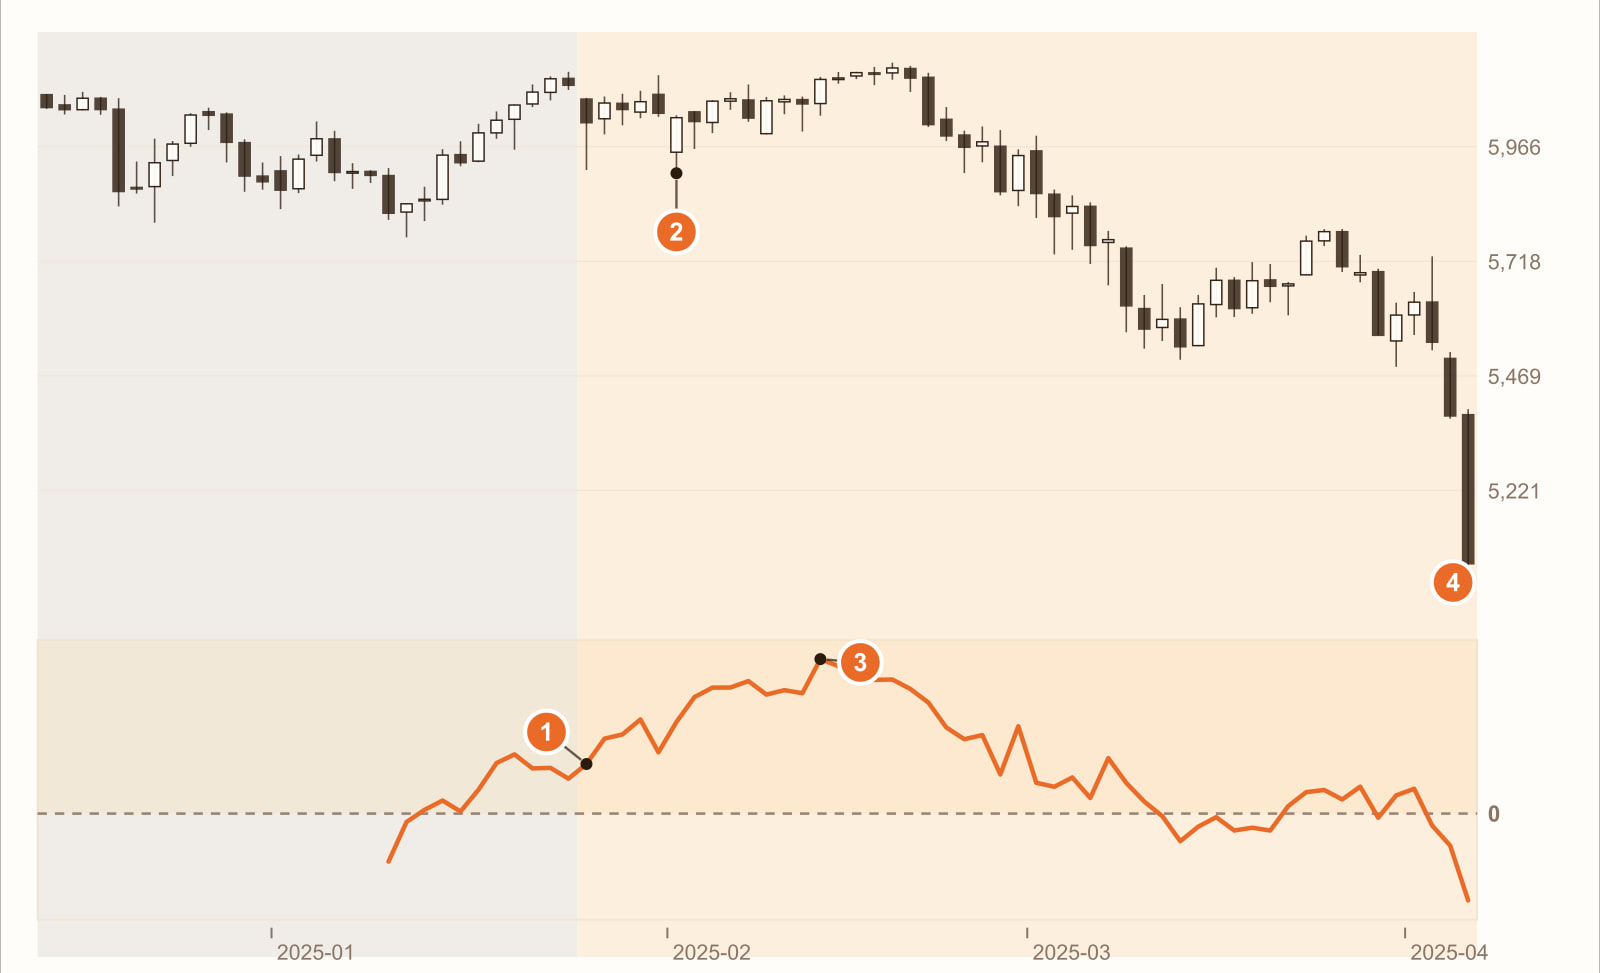
When the decline began, CMF was +0.119 (27 January 2025). Over the last 20 bars of the preceding range, the higher-volume days mostly closed near the high, so CMF went into the decline with a positive value.
A down close, yet near the day’s high (3 February 2025). The close was down 0.16% on the day, but after selling off intraday the market climbed back, for a CLV of 0.91. Every candle like this, with a long lower wick, pushes CMF up.
CMF’s peak: +0.372 (13 February 2025). At this point the price was still 1.6% above where the decline started; 4 trading days later (19 February) it closed at the high of this stretch, 6,136, and only then did it really start to fall. When CMF was at its strongest, the big drop was only days away.
When the decline ended, the price was down 15.9% (4 April 2025). Over these 50 bars, CMF was above 0 on 78% of the days, with an average of +0.132; 60% of the days closed in the upper half of their range. Only on 12 March, once enough candles had closed near their lows, did CMF drop below 0 for the first time, and by then the price had already fallen a long way from its high.
This is a real stretch of historical prices, used to show how CMF behaves. It is not a general rule. Change the instrument, the timeframe or the period, and every number will change.
What you see, what it means
| What you see | What it usually means | But be careful |
|---|---|---|
| CMF above 0 | Recently, the high-volume days mostly closed near the day’s high | It doesn’t mean the price is rising (4 on the chart: during the 15.9% decline, it was above 0 on 78% of the days) |
| CMF below 0 | Recently, the high-volume days mostly closed near the day’s low | It doesn’t mean the price is falling |
| CMF hovering around 0 | No clear lean in where the closes land | A ±0.05 threshold cuts down the flip-flopping |
| Price falling, CMF high | Every day bounces back from the lows | It may just be rebounds after sell-offs, not a bottom (3 on the chart) |
| CMF suddenly jumps | A high-volume candle from 20 bars ago has just dropped out of the window | Count back 20 bars to find the cause |
How to use it: three examples
Example 1: use it to confirm trend trades, not to pick a direction
Use price to decide the direction first, then confirm with CMF. The rule can be written as: “Go long only when the price is above its 50-period moving average and CMF is above 0.05.” CMF only answers “are the closes leaning strong?”; direction is left to price.
Example 2: look for divergence against price
The price makes a new low but CMF is higher than last time, meaning sell-offs are often followed by a climb back to near the day’s high. It is a clue, not a buy signal: in the decline on the chart, CMF was positive most of the time and the price still fell 15.9%.
Example 3: use thresholds to cut noise
CMF easily flips back and forth around 0. Changing the condition from “above 0” to “above +0.05”, and from “below 0” to “below −0.05”, removes some of the signals that flip-flop around 0. The right threshold has to be backtested on your instrument.
All three examples come back to one thing: CMF tells you “where each day closed”. A decline that keeps closing near the highs looks strong to CMF.
Common mistakes
1. Treating CMF above 0 as money flowing in
In the 50-bar decline on the chart, CMF was above 0 on 78% of the days, averaging +0.132, while the price fell 15.9%. CMF’s “inflow” only means the closes leaned towards the top of the day’s range.
2. Using CMF on its own as a direction indicator
CMF doesn’t know whether today is higher or lower than yesterday. Use “go long when CMF is above 0” on its own and you will keep going long all through a decline. Direction has to be judged separately.
3. Reading it as real money on CFDs
Volume on CFDs is mostly the number of quote changes. What CMF reflects on CFDs is “on the days with the busiest quoting, did the price close near the high or the low?”
FAQ
What is the CMF indicator?
CMF (Chaikin Money Flow) was introduced by Marc Chaikin. It sums “the close-position score CLV × volume” over the last 20 bars and divides by the total volume, giving a value between −1 and +1.
How do CMF and A/D differ?
Both use the same CLV. A/D keeps a running total from some starting day, so only its direction can be read; CMF only covers the last 20 bars and divides by total volume, so its value has a fixed range and can be compared across different periods.
How do CMF and MFI differ?
MFI looks at whether the typical price is higher or lower than the previous bar’s, and is essentially an RSI with volume added; CMF looks at where the close lands within the day’s high-low range and doesn’t compare with the previous bar.
Does MT5 have CMF?
MT5 doesn’t have a built-in CMF; you need to install a custom indicator. The built-in Chaikin Oscillator is a different indicator: the 3-period EMA of A/D minus its 10-period EMA.
Conclusion
CMF sees a real detail: where each day closes. But it calls that detail “money flow”, which makes it easy to read as “money is coming in, so the price will rise”.
So the real question is: on your instrument, when “CMF above 0.05” is used to confirm long trades, does it filter out false breakouts, or good moves? One stretch of historical prices cannot answer that; you need to backtest the rule across many stretches of the market.
No rules of your own yet, and don’t want to piece them together one indicator at a time? With MASQuant’s Strategy Genie, you just pick an investment style first; the AI analyses market conditions, selects instruments and gives you three candidate strategies at once. Each one has already been backtested on historical data, with its returns and maximum drawdown of capital laid out in full, and then you decide whether to deploy it to MT5.
If you already have an idea of your own, write the condition as one sentence, for example “go long only when the price is above its 50-period moving average and CMF is above 0.05”, give it to the AI Strategy Assistant, and press go to start the backtest. The backtest environment includes real market frictions such as spreads, slippage, changes in market liquidity and execution delays (see the AI Strategy Assistant guide for how to use it). Then remove the CMF condition and run it again, and you will see whether it actually helped. A backtest tells you “how this rule performed in past market conditions”, not a guarantee about the future.
An idea only becomes a strategy once it’s been tested.
The price chart in this article is taken from historical prices on the MT5 platform (daily; quotes and daily candle cut-off times differ slightly between platforms, so values may not match exactly), and the indicators are calculated by a program using the standard formulas; the round numbers in the example are not market data. Historical prices are used only to show how the indicator behaves and do not represent future price movements.
Risk disclosure: CFDs are high-risk financial products and can lead to rapid loss of capital. Past performance does not guarantee future results. All strategies and backtests are for reference only and do not constitute investment advice. Please read our Risk Disclosure carefully before trading.


