
What Is the ZigZag Indicator? Why the Highs and Lows It Draws Get Redrawn
“The highs and lows ZigZag marks are spot on. Just buy at its lows and sell at its highs, right?”
ZigZag’s chart looks accurate because it changes. The last leg it draws is never confirmed: when the price makes a new high, the previous “high” is erased and moved to the new spot. We recalculated MT5’s ZigZag every day on the daily charts of 9 instruments and counted: for every turning point that remains, nearly 5 were drawn at some point and later erased. This article first uses a table to show how it changes, then a real chart marked 1 to 4 (Ethereum, 2025).
This article is part of MASQuant’s “Trading Academy · Technical Indicators” series. All the indicators are sorted by category in Technical Indicators: The Complete Guide.
In one sentence
ZigZag = connecting the “big enough” highs and lows into a zigzag line, and ignoring the small moves.
The question it answers: “Where are the main turning points in this stretch of the market?” But it answers after the fact.
ZigZag is like writing a memoir: connect the peaks and valleys of a life and the story becomes clear. But the author is still alive while writing, and what looks like “the peak of my life” today may be overtaken by a higher peak next year. The last chapter is always still being rewritten; only the earlier chapters stay put.
Work it out once: how a high gets moved
Below is a simplified example showing where ZigZag’s “last point” is drawn after each day’s close (the following are round numbers made up for the example, not market data):
| Day | Day’s high | Day’s low | ZigZag’s last point |
|---|---|---|---|
| Day 3 | 105 | 101 | Day 3’s 105 (new high) |
| Day 4 | 103 | 100 | Still day 3’s 105 |
| Day 5 | 108 | 104 | Moves to day 5’s 108; day 3’s point is erased |
| Day 6 | 106 | 101 | Still day 5’s 108 |
| Day 7 | 101 | 95 | A new low at 95 is drawn, and only now is day 5’s 108 confirmed |
Looking at the chart on day 4, you would think 105 was the high; by day 5 it is gone. A high only counts once the next point in the opposite direction has been drawn, and by then the price has already fallen some way from the high.
The formula
The ZigZag that comes with MT5 has three parameters, with defaults of 12, 5 and 3:
1 Depth = 12: a point must be the highest (lowest) of the last 12 bars to qualify as a turning point
2 Deviation = 5: a price-distance threshold, measured in the quote's smallest tick
3 Backstep = 3: the minimum number of bars between two turning points in the same direction; if they are closer, only the more extreme one is kept

Highs and lows alternate; when a higher high (lower low) appears, the last point moves to it
ZigZag has no recognised inventor, and platforms calculate it in slightly different ways: some use a fixed percentage (for example, a move only counts if it exceeds 5%), while MT5’s example indicator uses the three parameters above. Whichever version you use, the last leg will change; the only difference is how often.
MT5’s ZigZag is one of the example indicators installed with the platform (in the Examples folder); it is not built directly into the indicator list.
The statistics: how often are turning points erased, and how long until they are confirmed?
We rewrote MT5’s ZigZag(12, 5, 3) from its source code and, on the daily charts of 9 instruments (gold, silver, the S&P 500, Germany 40, EUR/USD, GBP/USD, USD/JPY, Bitcoin and Ethereum) since 2015, recalculated it after every day’s close, recording what it looked like each day:
| Item | Result |
|---|---|
| Turning points that finally remained | 1,487 |
| Positions once drawn as turning points and later erased | 7,327 (about 4.93 erased for every 1 that remains) |
| How many bars a turning point takes to be confirmed (median) | 6 bars (half fall between 4 and 9 bars) |
| Takes 10 bars or more to be confirmed | 22.2% |
| Takes 20 bars or more to be confirmed | 2.2% |
| How far the price has moved from the turning point when it is confirmed (median) | 2.69 × ATR(14) |
“Confirmed” means it is still there in every later daily recalculation, and the next point in the opposite direction has already been drawn after it. Calculated separately for each of the nine instruments, the medians all fall between 5 and 7 bars. In other words, by the time ZigZag tells you “that was the high”, the price has usually already moved nearly 3 ATRs away from it.
Read the chart: Ethereum in 2025, following 1 to 4
The chart below shows Ethereum (ETHUSD) on the daily timeframe from late February to late June 2025, taken from MT5’s historical prices. The solid orange line is ZigZag calculated on the whole stretch of data (that is, what it looks like “after the fact”); the dashed purple line is ZigZag calculated only on data up to 7 May (that is, what you would have seen on the chart on 7 May itself).
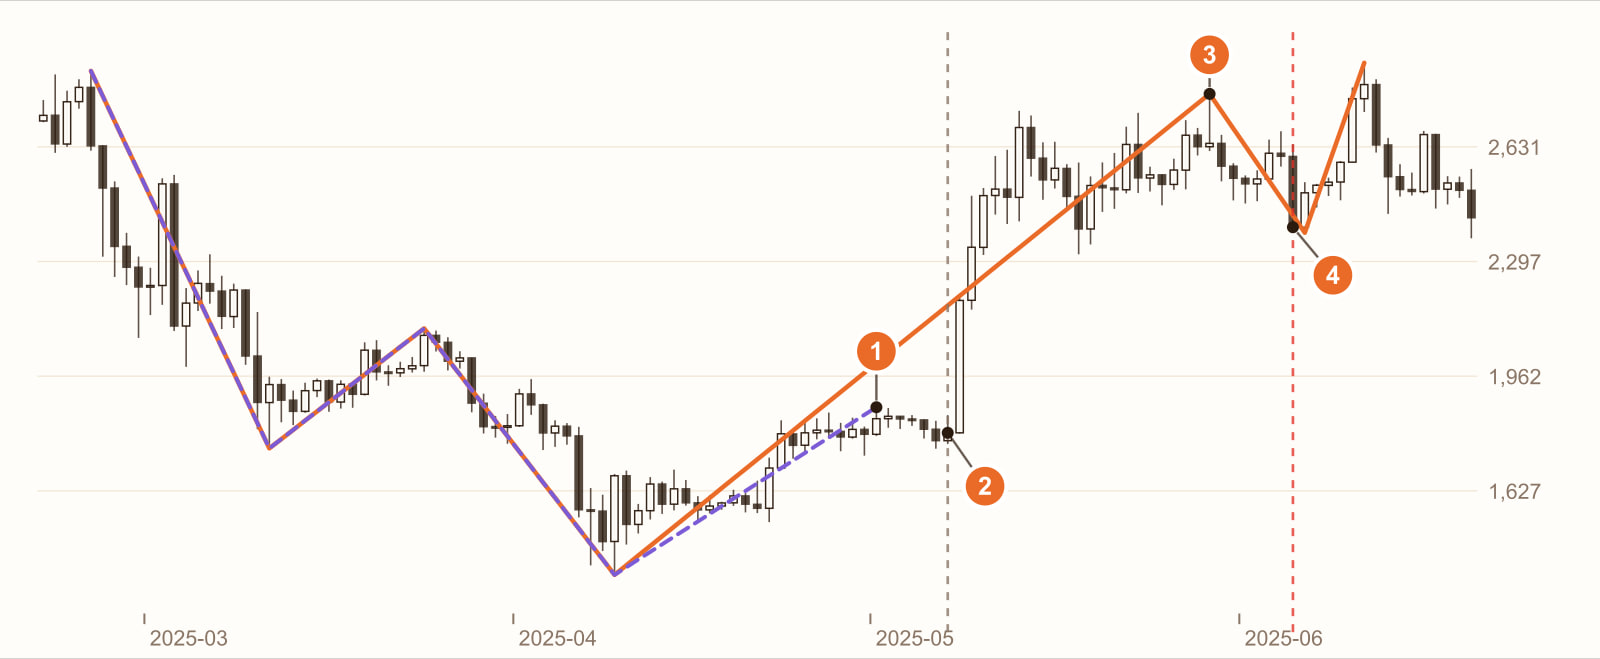
The “last high” at the time: 1 May 2025, 1,871.46.
Looking at the chart on 7 May (close 1,796.69). That day’s ZigZag drew 1, 6 days earlier, as the most recent high, and every price since then had been lower than 1. It looked as if a high had formed and the price was heading down.
The real high: 29 May, 2,786.02. The very next day (8 May), Ethereum surged, climbing all the way to a level 48.9% above 1. The point at 1 was erased, and the after-the-fact ZigZag (orange line) connects straight from the April low to here, as if 1 had never existed.
The high at 3 was only confirmed on 5 June, 7 bars late. That day the price closed at 2,396.74, already 14.0% below the high. On the day of 3 and for several days after, you still could not know it was the high.
This is a real stretch of historical prices, used to show how ZigZag behaves. It is not a general rule. Change the instrument, the timeframe or the period, and every number will change.
What you see, what it means
| What you see | What it usually means | But be careful |
|---|---|---|
| The last leg of ZigZag | The latest high or low for now | Not yet confirmed; it may be moved at any time (1 on the chart) |
| The line up to the second-to-last point | Highs and lows that are already confirmed | By the time they are confirmed, the price has usually moved nearly 3 ATRs |
| A line that neatly connects every high and low | What it looks like after the fact | For every point that remains, about 5 were drawn and then erased |
| Each high higher than the last, each low higher than the last | An upward structure | Judge it only with points that are already confirmed |
| Larger parameters (for example Depth 20) | Only bigger turning points remain | Confirmed even more slowly |
How to use it: three examples
Example 1: organise past highs and lows, rather than predicting the next one
ZigZag is most useful for boiling a mass of candles down to a few major highs and lows, which makes it easier to draw Fibonacci retracements or find previous highs and lows (for a Fibonacci example, see What is Fibonacci retracement?). When you use it, only use points that are already confirmed.
Example 2: judge structure only with “confirmed points”
The rule can be written as: “It only counts as an upward structure if, of the two most recent confirmed lows, the later one is higher than the earlier one.” The last, unconfirmed point is not counted.
Example 3: rewrite the ZigZag idea as a condition you can know “in the moment”
If your idea is “go long when the price breaks the previous high”, in a backtest you can write it as “the close breaks above the highest price of the last 20 bars”: that condition can be calculated on the day itself and will not change after the fact.
All three examples need to remember one thing: ZigZag is a tool for organising things after the fact. The prettier the points it draws, the more you should ask: on what day was this point actually confirmed?
Common mistakes
1. Backtesting with ZigZag’s highs and lows
Using after-the-fact ZigZag points as buy and sell points makes a backtest look superb, because every point was drawn only after the price had finished moving. In real trading, you buy at spots like 1, and you never get to wait for 3.
2. Treating the last leg as a turn that has already happened
On the day of 2 on the chart, ZigZag drew 1, 6 days earlier, as a high, and the price looked as if it was heading down. Afterwards the price rose 48.9% above 1, and that point was erased.
3. Thinking that larger parameters stop the repainting
A larger Depth gives fewer turning points, but the last leg still changes, and confirmation takes even longer. Repainting is built into ZigZag’s algorithm itself; it is not a parameter problem.
FAQ
What is the ZigZag indicator?
ZigZag connects highs and lows that exceed a certain size into a zigzag line, filtering out small moves to show the main turning points in the market. The default parameters of MT5’s example indicator are Depth 12, Deviation 5 and Backstep 3.
Why does ZigZag repaint?
Because the last turning point is not yet confirmed: when the price makes a new high (or a new low), the last point moves to the new position. Only once the next point in the opposite direction has been drawn does the previous point stop changing.
Can ZigZag be used for trading?
It can be used to organise highs and lows that are already confirmed and to read structure, but it is not suited to being used directly as a buy or sell signal. In our statistics, a point takes a median of 6 bars to be confirmed, and by then the price has usually moved about 2.7 ATRs from the turning point.
Does MT5 have ZigZag?
Yes. It is one of the example indicators installed with MT5 (in the Examples folder), with default parameters of 12, 5 and 3; it is not built directly into the indicator list.
Conclusion
The chart ZigZag draws is the “after-the-fact version” of the market: very clear, and very tempting. Its value lies in organising the past, not in predicting the next turning point.
So the real question is: if your strategy uses ZigZag’s highs and lows, does your backtest use the points as they stood “once confirmed”, or points that were only drawn after the fact? One stretch of historical prices cannot answer that; you need to backtest the rule across many stretches of the market.
No rules of your own yet, and don’t want to piece them together one indicator at a time? With MASQuant’s Strategy Genie, you just pick an investment style first; the AI analyses market conditions, selects instruments and gives you three candidate strategies at once. Each one has already been backtested on historical data, with its returns and maximum drawdown of capital laid out in full, and then you decide whether to deploy it to MT5.
If you already have an idea of your own, write the condition as one sentence, for example “go long when the close breaks above the highest price of the last 20 bars, and exit when it breaks below the lowest price of the last 10 bars”, give it to the AI Strategy Assistant, and press go to start the backtest. The backtest environment includes real market frictions such as spreads, slippage, changes in market liquidity and execution delays (see the AI Strategy Assistant guide for how to use it). Only with conditions like this, which can be calculated on the day itself, will the backtest results match real trading. A backtest tells you “how this rule performed in past market conditions”, not a guarantee about the future.
An idea only becomes a strategy once it’s been tested.
The price chart in this article is taken from historical prices on the MT5 platform (daily; quotes and daily candle cut-off times differ slightly between platforms, so values may not match exactly). ZigZag was rewritten from the source code of the example indicator that comes with MT5, and the statistics use daily data from the same platform for 9 instruments (gold, silver, the S&P 500, Germany 40, EUR/USD, GBP/USD, USD/JPY, Bitcoin and Ethereum) from January 2015 onwards, recalculated after every day’s close; the way it updates in real time on MT5 charts is slightly different, so the numbers may differ. The round numbers in the example are not market data. Historical prices are used only to show how the indicator behaves and do not represent future price movements.
Risk disclosure: CFDs are high-risk financial products and can lead to rapid loss of capital. Past performance does not guarantee future results. All strategies and backtests are for reference only and do not constitute investment advice. Please read our Risk Disclosure carefully before trading.


