
What Is Williams %R? The Fastest Oscillator, and the Noisiest
“Williams %R has hit −20, it’s overbought.”
Williams %R is one of the fastest oscillators. The upside of being fast is that it warns you very early that “this move has gone up a lot”; the downside is that it warns too often, and many of those warnings come to nothing. This article first works it out once with 4 closing prices, then uses a real chart marked 1 to 4 (the S&P 500 in 2023) to show just how fast, and how noisy, it really is.
This article is part of MASQuant’s “Trading Academy · Technical Indicators” series. All the indicators are sorted by category in Technical Indicators: The Complete Guide.
In one sentence
Williams %R = which “floor” of the last 14 candles’ high-low range today’s close lands on.
The question it answers: “Did today close near the top or near the bottom of the recent stretch?”
Picture the range from the highest to the lowest price of the last 14 candles as a building: the high is the top floor, the low is the ground floor. Williams %R tells you “which floor today closed on”: 0 is the top floor, −100 is the ground floor. It does not care how you got up there, only which floor you are on now.
Work it out once: 4 closing prices are enough
Suppose the highest price of the last 14 candles is 110 and the lowest is 100 (these are round numbers made up for the example, not market data). The calculation is: (high − close) ÷ (high − low) × −100.
| Today’s close | Calculation | %R | In plain words |
|---|---|---|---|
| 110 | (110 − 110) ÷ 10 × −100 | 0 | Closed at the highest point of the last 14 candles (the top floor) |
| 108 | (110 − 108) ÷ 10 × −100 | −20 | Closed in the top 20% of the range, right on the “overbought line” |
| 105 | (110 − 105) ÷ 10 × −100 | −50 | Right in the middle |
| 101 | (110 − 101) ÷ 10 × −100 | −90 | Near the lowest point, already below the −80 “oversold line” |
Notice that it involves no averaging at all: close a little higher today and the number jumps straight up; close a little lower tomorrow and it drops straight down. That is why it is fast, and also why it is noisy.
If you have learned the KD (stochastic) indicator, you will notice that Williams %R is simply an unsmoothed KD drawn upside down (%R = fast %K − 100). In KD, both K and D are averaged once more, so KD is slower than Williams %R, and less noisy.
The formula
%R = (N-period high − close) ÷ (N-period high − N-period low) × −100Williams %R was introduced by Larry Williams. The usual period is 14, and its values range from 0 to −100: above −20 is often called overbought, below −80 is often called oversold. In MT5 it is the built-in Williams’ Percent Range, with a default period of 14 and reference lines at −20 and −80.
Read the chart: the S&P 500 in 2022–2023, following 1 to 4
The chart below shows the S&P 500 index (US500) on the daily timeframe from late October 2022 to August 2023, taken from MT5’s historical prices. In the first half it moved sideways between 3,718 and 4,155 for nearly five months; from April 2023 it headed higher, closing at 4,574 on 1 August.
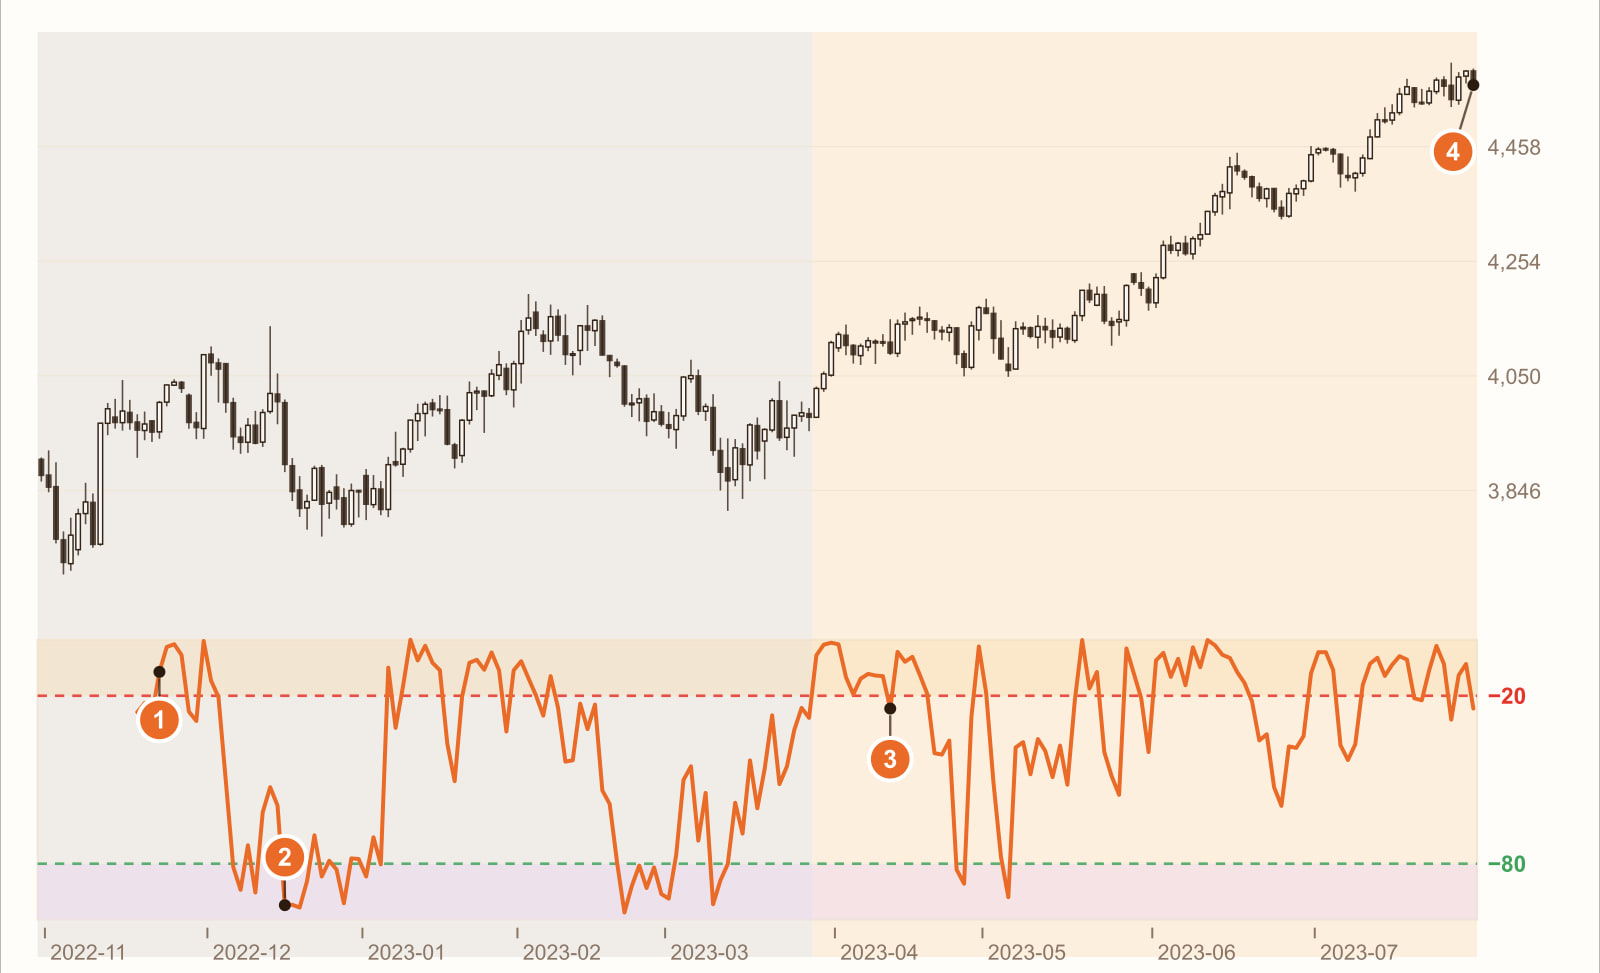
In the range, it touches −20 (22 November 2022). The price had only reached the top of the range, yet Williams %R was already “overbought”.
In the range, it drops below −80 (15 December). The price reached the bottom of the range, and it was “oversold” again. Over the whole range, it rose above −20 7 times and dropped below −80 9 times; over the same stretch, RSI(14) never once touched 70 or 30. Looking at the same 14 candles, Williams %R is far busier.
During the rally, the first “drop back below −20” (12 April 2023). On the 10th bar after the rally began, the price paused for breath, the close slipped a little further from the 14-candle high, and it fell from above −20. If the rule is “sell when it drops back from above −20”, this is where you would have sold.
1 August: the price was another 11.8% above 3. Over the 90 bars of the rally, Williams %R spent 51 bars above −20, but “dropping back below −20” happened 10 times in all. Every one of them was a sell signal that did not hold.
This is a real stretch of historical prices, used to show how Williams %R behaves. It is not a general rule. Change the instrument, the timeframe or the period, and every number will change.
What you see, what it means
| What you see | What it usually means | But be careful |
|---|---|---|
| %R above −20 | The close is near the high of the last 14 candles | In a strong market it can stay here for a long time (after 3 on the chart) |
| %R below −80 | The close is near the low of the last 14 candles | In a weak market it can likewise stay here for a long time |
| %R swings between the two extremes in a range | The price is moving between the top and bottom of the range | This is when it is most useful (12 on the chart) |
| %R drops back from above −20 during a rally | The price has moved slightly away from its recent high | Often just a pause for breath, not weakness (3 on the chart) |
How to use it: three examples
Example 1: use it only in ranges
First use a moving average or ADX to judge whether the market is moving sideways. If it is, use −20 and −80 to find the top and bottom of the range; if there is a trend, do not use it to trade against the trend. For how to read ADX, see What is the ADX indicator?
Example 2: look for pullbacks in the direction of the trend
Use it the other way round: when the bigger direction is up (for example, the price is above the 60-day line), ignore −20 and wait for %R to drop below −80 and then turn back up, treating that as the moment “the pullback is over”. That way its speed is put to work in the direction of the trend.
Example 3: add a confirmation condition
Instead of acting the moment it touches −20, only count it as weakening once it falls back below −50. The more conditions, the slower it gets, but you avoid false signals caused by a mere “pause for breath” like the one at 3.
Common mistakes
1. Selling at −20 and buying at −80
In a trend, this rule keeps you trading against it. In the rally on the chart (April to August 2023), “dropping back below −20” alone happened 10 times.
2. Making the period even shorter
14 is already fast. Setting it to 5 or 7 makes it touch one extreme or the other every few bars, producing so many signals that they lose all meaning.
3. Forgetting that it is negative
Williams %R runs from 0 to −100, and the closer to 0, the more “overbought”. Some platforms draw it from 0 to 100 instead, so when you switch platforms, check which way the scale runs first.
FAQ
What is Williams %R?
Williams %R was introduced by Larry Williams. It measures where the close sits within the high-low range of the last N candles; its values range from 0 to −100, and the usual period is 14. For example, if the last 14 candles have a high of 110 and a low of 100 and today closes at 108, %R is −20.
How is Williams %R different from KD?
Williams %R equals an unsmoothed fast %K drawn upside down (%R = %K − 100). In KD, both K and D are averaged, so KD is slower and less noisy. For KD’s trade-offs, see Should you enter on a KD golden cross?
Which is better, Williams %R or RSI?
Neither is better in absolute terms. Williams %R is faster and noisier; RSI is smoothed, so it is slower and steadier. Which suits you depends on your holding time and your instrument, and the best way to find out is to compare them with a backtest.
What period should I use for Williams %R?
14 is the default in MT5 and most charting platforms. Shorter makes it more sensitive and noisier; longer makes it smoother. There is no standard answer; test it on your own instrument.
Conclusion
Williams %R’s speed is real: in the same range, it touches the two extremes far more often than RSI. Its noise is real too: in a trend, it drops back again and again, calling sell signals that do not hold. Both come from the same design: no averaging of any kind.
So the real question is: on your instrument and with your holding time, is the head start this speed gives you worth all the extra false signals? One stretch of historical prices cannot answer that. Backtest it with our AI Strategy Assistant and you will know.
Write the condition as one sentence, for example “enter when Williams %R rises back above −80 from below, exit when it touches −20”, give it to MASQuant’s AI Strategy Assistant, and press go to start the backtest. The backtest environment includes real market frictions such as spreads, slippage, changes in market liquidity and execution delays (see the AI Strategy Assistant guide for how to use it). A backtest tells you “how this rule performed in past market conditions”, not a guarantee about the future.
An idea only becomes a strategy once it’s been tested.
The price chart in this article is taken from historical prices on the MT5 platform (daily; quotes and daily candle cut-off times differ slightly between platforms, so values may not match exactly), and the indicators are calculated by a program using the standard formulas; the round numbers in the example are not market data. Historical prices are used only to show how the indicator behaves and do not represent future price movements.
Risk disclosure: CFDs are high-risk financial products and can lead to rapid loss of capital. Past performance does not guarantee future results. All strategies and backtests are for reference only and do not constitute investment advice. Please read our Risk Disclosure carefully before trading.



Comment
What Is Stochastic RSI? Formula, Worked Example, Reading 80/20 and How It Differs from RSI
October 24, 2026[…] What Is Williams %R? The Fastest Oscillator, and the Noisiest […]